Download
1 / 21
210 likes | 315 Vues
Risk indicators for better crop management in hilly terrain. Modelling Impacts of Water and Thermal Stress. Richter GM, Acutis M., Mayr T., Rana G., Simota C. Importance of water and thermal stress. Global warming rise of temperature change of rainfall distribution

E N D
Risk indicators for better crop management in hilly terrain Modelling Impacts of Water and Thermal Stress Richter GM, Acutis M., Mayr T., Rana G., Simota C.
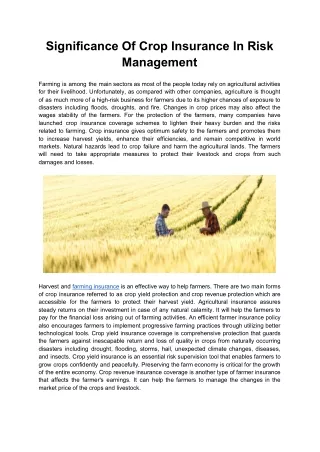
Importance of water and thermal stress • Global warming • rise of temperature • change of rainfall distribution • increase of summer drought • Water & Energy Balance • interdependence • less cooling by transpiration • Crop management actions • breed for drought tolerance • select varieties for WUE • quantify and mitigate heat stress Predictions of change in Tair and precipitation for the United Kingdom, based on HadCM3 displaying three different emission scenarios (Hulme et al., 2003)
Focus on hilly terrain - why? • Expansion of arable • in Italy ca. 50 % of arable land is located on hills • transformation of agriculture in new member states and CEEC • Enhanced driving forces • impacts of CC will be greater • variability will be affected • Crop yield effects • historical risk analysis shows significant effect of slope • yields are below economic threshold more frequently with increasing slope • effects are crop specific Probability of average winter wheat yields below economic threshold (1.0 t/ha, = “null” benefit) rise with average slope (Romania, NUTS3, 1964 -2000). no predominant aspect more north oriented slopes more south oriented slopes (Simota, 2003)
Key motives for our work • Importance of drought and heat stress will increase in the future • Temporal variability of meteorological events will be enhanced by spatial variation • Crop model needs a better structure and finer tuning for physical impacts • Risk indicators for crop management must be probabilistic and spatially resolved
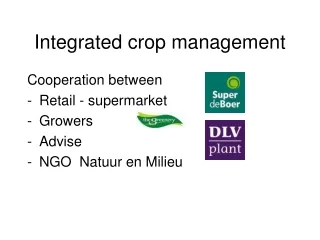
The modelling & decision framework • More physics into crop models • Derive abiotic stress indices • Relate stress level to landscape • Identify users and stakeholders • Iterate mitigation procedure
Objectives of work programme • To compile relevant meteorological and crop growth data • To model impacts of terrain on water and energy fluxes • To model impacts of abiotic stress on yield formation • To extrapolate landscape effects on water and energy fluxes using a digital terrain model • To generate simple and complex indicators using a GIS-integrated model • To optimise management response using a socio-economic framework (OECD - DPSIR)
Agro-Ecological Indicators - Criteria • related to measurable indicators and historical information • specific in space by including terrain-driven changes in the energy and water balance, and • functional and predictive by accounting for future (climatic) scenarios • probabilistic and quantitative to relate risks to environmental and economic thresholds
Agro-Ecological Indicators - Definition • Derived from topographic, soil, climatic and crop management variables • Observed or generated by using process simulation models (for soil-plant-atmosphere) • Probabilistic site- & crop-specific indices • Up-scaled using digital terrain model (DTM) • Extrapolated to future using climate scenarios (GCM)
Methods (1) - Soil Wetness Indices • Field surveys and mapping, map utilisation • Monitoring soil moisture • Field maps of soil types and properties • A variety of wetness indices are calculated from soil properties and topographic parameters • Using "TAPES-G" (Galant, et al., 1997)) • Showing areas expected to have HIGH to LOW soil water content. • Calculations use the 1:25000 Biggleswade Sheet (NSRI). - Soil Parameters used: • Saturated Hydraulic Conductivity, • Porosity and • Soil Depth
Energy balance module Soil water balance module ET Soil water content Tsurface, Tair in all grid cells in all gridcells Methods (2) - Micro-meteorology Soil Hydrology Monitoring Permanent weather stations Topographic Locations Mobile weather stations Eddy Covariance fluxes Modelling System
sensor Slide-on case 60 mm Tube 50 mm 60 deg angle cable nuts ventilation holes Methods (3) - Crop Water Stress Index • Measure canopy temperature (Tc) and calculate CTD (Tc-Tair) • Scale CTD for VPD (a) and define CWSI as a/b • Transpiration is Zero at upper boundary (Tc= 7) dead leaves • Tact /Tpot= 1 - CWSI
Methods (4) - heat stress in wheat; Thermal Stress Index (TSI) • Based on method developed by Ferris et al. (2000) in European project (CLIVARA) • calculating the thermal time of heat stress, TT(HS) [oC min], accumulated Tair > 30 oC after anthesis • based on air temperature Tmin and Tmax; • sensitive period is 30 days after anthesis • Yield reduction due to heat stress, YR(TS), is calculated as a fraction of yield under water-limited conditions • YR(TS) = 0.000164 * TT(HS) [C min] • Yield(TS) = Yield(nonTS) * (1 - YR(TS))
Steady State SWI Quasi-dynamic SWI Results (1) - soil wetness indices
Results (2) – Modelling ET • Micro-met Model has been tested in one season • Sensitivity to inputs was tested • Data shown are from Italian catchment • Validation for UK in progress • Model outputs match observations with acceptable accuracy (± 15%)
Results (3) - CWSI in sugar beet, 2003 Preliminary conclusions • Even mild irrigation reduced average daily thermal water stress • 10 out of 27 observations in the non-irrigated plot had a CWSI > 0.5 • Difficulties arise from incomplete cover (scaling is needed for LAI) • Yield differences reflect the differences in CWSI
Results (4) – Impact of heat stress on UK wheat yields • Based on Tair > 30 C period after anthesis during grain filling (30 d) • Scenarios for low (TOP) and high (BOT) emission • Weather predicted for East England using HadCM3 • Extreme yield losses only in the 2080s under HI
Results (5) – Model Tsurface • Objective to model CTD, CWSI from Energy Balance Model following Penman-Monteith resistance approach • Rn calculated acc. to Norman et al. 1995 • Stomatal resistance calculated acc. to Jarvis et al. (1976) • Inputs are Rg, VPD, Tair, rel SWC • Key question is to separate Rns from Rnc
Conclusions & perspectivesMicro-meteorology • Results of sensitivity analysis: acceptable output error (≤±10%) on Tair, LE and Rn inputs should not exceed following errors • Slope ±20% • Height difference ±20% (for the wind speed) • Azimuth ±20% • Shape of the hill important for wind speed • Length of the hill ±50% • Green canopy ±10% for LE; ±40% for other inputs • CTD/CWSI and heat stress can be modelled, if we know • Green Area Index (ground cover) • Available soil water (rooting depth, water uptake efficiency
Conclusions & perspectives Crop Modelling • Indicators based on new Soil-crop-atmosphere Interaction Model deliver • Micro-meteorology: transpiration and crop temperature • Risk indicators for crop development anomalies • Risk indicators for crops failure • Further development should expand model for major root traits • Root/shoot ratio and allocation • Root distribution and architecture • Water uptake efficiency as a limiting determinant of WUE (source) • Nutrient (N, P) uptake efficiency as limiting determinant of RUE
Conclusions & perspectivesSpatial applications • Indicators based on DTM, Soil and Meteorological Data using “TAPES-G” • Soil Wetness • Energy balance (Temperature and Solar Radiation parameters) • Potential Evapotranspiration • New Model could include indicators reflecting crop water and physiological status • Crop water stress index (actual ET) • Canopy temperature (stress levels) • Yield, crop failure and sustainability of cropping systems