Download
1 / 36
360 likes | 481 Vues
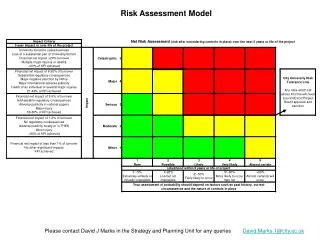
NBSC Application Risk Model. August 08, 2011 Refinement of Presentation Delivered by A. Robinson On June 3, 2011. Manifold Data Mining Inc. Objectives. To develop a Risk Model that will be used to score new loan applications, based on personal data collected through loan application forms.

E N D
NBSC Application Risk Model August 08, 2011 Refinement of Presentation Delivered by A. Robinson On June 3, 2011 ManifoldData Mining Inc.
Objectives To develop a Risk Model that will be used to score new loan applications, based on personal data collected through loan application forms. ManifoldData Mining Inc. 2
Input Data NBSC Loan Application Forms (# Applicants =385) Name; Demographics info, such as date of birth, gender, marital status; Income, assets and expenses; Loan Type; Loan amount; Purchase price. Phoenix databaseof existing JNBS loans(# customers =272) RIM Personal Information; Loan Accounts. Time Frame March 1st, 2003 to March 18th, 2011. ManifoldData Mining Inc. 3
Risky Loans A risky loan is defined as a loan that has had at least one delinquency of 90 days, or two delinquencies of 60 days, during the life-time of the loan. ManifoldData Mining Inc. 4
Loan and Application Information Loan information, including information about risky loans, is stored in the Phoenix database. Application information, i.e., predictors of the model, are from the loan application forms. These are two different systems. We matched the application data with the Phoenix data to prepare the modeling dataset. ManifoldData Mining Inc. 5
Match Application and Phoenix Data The matching process consists of: 1. Cleaning the keyed-in application data; 2. Matching the data by applicants’ names. We matched 229 customers who held 279 loan accounts. There are 82 bad loans. The risk rate is 29.3%. ManifoldData Mining Inc. 6
Summary of Findings Profiling Analysis of Risky Loans ManifoldData Mining Inc. 7
Profile: Application Year Risky loans develop with time. The longer the time, the higher the proportion of risky loans. ManifoldData Mining Inc. 8
Profile: Income The average total monthly income is $7,800, for an annual income of $93,600. Lower income customers (monthly $5K and below) are less risky than higher income customers ($8K and higher). There is no difference among median income customers in terms of risk. ManifoldData Mining Inc. 9
Profile: Income – Cont’d High income customers ($8K and higher) have larger loans and expose us to higher risks. ManifoldData Mining Inc. 10
Profile: Age 40% of applicants were in the age group 41-50 when they applied for a loan. Applicants in the age group 41-50 represent a higher risk than others. ManifoldData Mining Inc. 11
Profile: Marital Status Married applicants have a relatively low risk. Those with unknown marital status represent a higher risk. ManifoldData Mining Inc. 12
Profile: Number of Dependents Applicants with one dependent represent a lower risk than others. When the number of dependents is unknown or zero, this poses a higher risk. ManifoldData Mining Inc. 13
Profile: Nationality Cayman applicants represent a higher risk than applicants with dual nationalities of Cayman/Jamaica and other countries (British, USA, BOC etc.). ManifoldData Mining Inc. 14
Profile: EmploymentStatus 87% of applicants are employed, and 13% are self-employed. There is no difference between employed and self-employed applicants in terms of loan risk. ManifoldData Mining Inc. 15
Profile: Loan Amount The average loan amount applied is $180K. Large loans (more than $250K) have higher risk. ManifoldData Mining Inc. 16
Profile: Loan Purpose/Purchase Price 56% of NBSC loans include a purchase price in the application form. These loans are mainly for purchasing a home or land. The other 44% of loans are not associated with a purchase price. Most of these loans are for the purpose of debt consolidation, refinancing, home renovation, buying a car/machine etc. There is no difference between these two types of loans in terms of risk. ManifoldData Mining Inc. 17
Profile: Total Liabilities Higher total liabilities poses a higher risk. ManifoldData Mining Inc. 18
Profile: Total Assets Applicants with over $500K of assets pose a relatively higher risk. ManifoldData Mining Inc. 19
Profile: High Assets and Large Loans High assets and high expenditures are highly correlated with large loans. That is why high assets may pose a higher risk. ManifoldData Mining Inc. 20
Profile: Total Monthly Expenditure Applicants with a median to high monthly expenditure are riskier than those with a low monthly expenditure. ManifoldData Mining Inc. 21
Model Refinement The initial model was presented to NBSC team by Anthony Robertson on June 3rd, 2011. Following up discussions lead to adjustment of the model with consideration of the following factors: Gender and joint applications Ratio of income and expenditure Correlation between high income and large loans ManifoldData Mining Inc. 22
Profile: Joint Applicants 65% loans are originated from single applicants. Joint applicants are marginally riskier than single applicants. ManifoldData Mining Inc. 23
Profile: Gender Among single applicants male is riskier than female. ManifoldData Mining Inc. 24
New Predictor: Applicant Type Combining indicators of gender and joint applicants we introduce a new variable to describe type of applicants Female Single Applicant Applicant Type = Male Single Applicant Joint Applicants ManifoldData Mining Inc. 25
Profile: Applicant Type Female single applicants are less risky than both male single and joint applicants ManifoldData Mining Inc. 26
Profile: Salary Composition of total income is made up of salary, rent, investment, co-applicant income and other income. If salary income is the main source of income, it’s less riskier. We introduce a new predictor: ratio of salary to total income, which measures indirectly the risk of rent and co-applicant’s income. ManifoldData Mining Inc. 27
Profile: Ratio of Expense to Income If the ratio of expense to income is greater than 40%, it is riskier. Because of the small sample size and outliers, we choose 40% as the threshold. Refinement is required upon proper size of loan portfolio. ManifoldData Mining Inc. 28
Profile: Loan-to-Income Ratio If the loan-to-income ratio is greater than 3.5, the loan is risky. An unknown loan-to-income ratio also poses a higher risk. ManifoldData Mining Inc. 29
Application Risk Model: Predictors Upon correlation analysis of all the available variables, we identified the following predictors for the loan application risk model. They have the highest differentiating power of good and bad loans among all the variables. The contribution of the predictors to the application risk model is ranked below, in order of importance. ManifoldData Mining Inc. 30
Application Risk Model: Model Equation Logit = - 0.9403 + 1.3585 * G_Applicant_Type - 0.9864 * G_Salary_Income_Ratio + 0.6688 * G_Loan_Income_Ratio + 0.8824 * G_Expense_Income_Ratio + 1.1860 * G_Nationality + 0.7351 * G_Dependents Application_Risk_Model_Score = exp(Logit) / (1 + exp(Logit)) * 100 ManifoldData Mining Inc. 31
Model Performance The model score ranks loans by the degree of risk. The top decile (greatest risk) is 2 times higher than the benchmark. The lift is limited and subject to relatively large variation due to the small sample size. The lift between the top and bottom deciles is significant. The adjusted model has a better lift trend than the previous one. ManifoldData Mining Inc. 32
Risk Model: Score Summary The average model score is 29.39; 24% loans fall in the range 40-100, while 30% are below 20. ManifoldData Mining Inc. 33
Demo - Risk Score Prototype Let’s give it a try to see how it works!!
Sample Risk Score CategoriesFor Discussion Criteria to Adjust: • Interest rate • Deposit • Term • Reviews/adjustments • Guarantor • Other
Questions & Comments ManifoldData Mining Inc. 36