Download
1 / 35
350 likes | 476 Vues
Quadrant Diagrams, Levels of Conceptualization and Requisite Variety. Stuart A. Umpleby The George Washington University Washington, DC. Designing conceptual systems. Architecture students are taught to “think with your pencil”

E N D
Quadrant Diagrams, Levels of Conceptualization and Requisite Variety Stuart A. Umpleby The George Washington University Washington, DC
Designing conceptual systems • Architecture students are taught to “think with your pencil” • If one wants to design theories, philosophies, or social movements, how does one “think with one’s pencil”? • Quadrant diagrams are one possibility
The purposes of quadrant diagrams • Bring order to a variety of points of view • Compare personalities, fields of study, cultures, policies, strategies • Show how organizations or countries or fields of study change • Add a new dimension to a previous analysis
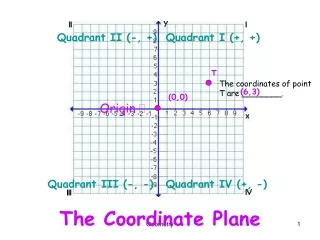
Rules for making quadrant diagrams • To conform with common time series graphs, put earlier positions in the lower left quadrant and later positions in the upper right quadrant • To conform with an optimistic outlook, put less desirable conditions in the lower left quadrant and more desirable conditions in the upper right quadrant
Quadrant diagrams as a way of clarifying a variety of positions
advocates of planning via networked computers Technology is good engineers Technology is bad political scientists left wing campus activists Participation is bad Participation is good Attitudes toward participation in planning
High task orientation Low task orientation High people orientation Low people orientation The “managerial grid”
Task oriented guided missile Eiffel Tower Growth oriented incubator family Hierarchy Heterarchy A taxonomy of corporate cultures
Cash Cow Star High Income Dog Low Income Problem Child Low Growth High Growth Boston Consulting Group portfolio management
Growth companies Value companies Low capitalization High capitalization Financial portfolio management
Normal accidents High complexity Low complexity Few connections Many connections The causes of “normal accidents”
Quadrant diagrams in the field of futures research and forecasting
Let the long boom roll From out of the ball park Low y2k impact Y2k whammy High y2k impact Double whammy No major economic calamity or terrorist event Major economic calamity or terrorist event Possible y2k outcomes, Marien
Don’t worry, be happy Egg-on-face false alarm Isolated Failure Big blame game begins Widespread Multiple Failures We did our best Intense but isolated efforts of business and government Major, globally coordinated mobilization Possible Y2K actions and outcomes, Marien
Fire in the theater Official future Isolated failures Millennial collapse Interdepend- ent failures Community and human spirit Social chaos Social cohesion Social response to y2k outcomes, Carmichael
Radical humanist Radical structuralist Sociology of radical change Interpretive Sociology of regulation Functionalist Subjective Objective Four paradigms of social theory, Burrell and Morgan
Socialist countries In 1950s Western Europe In 1960s Welfare state United States in 1920s Self reliance Central planning Free markets Convergence of capitalist and socialist societies
Perhaps Japan Russia Western democracies Democracy China Some third world countries Stalinist system Totalitar- ianism Central planning Free markets Two paths toward a mixed economy
Strong authority with openness (schools) glasnost Trust Democracy nationalities disputes Distrust with equality (international system) Strong authority with secrecy (USSR) Distrust Assume differences in capability Assume equality of opportunity Generating additional systems or strategies
USA intended path USSR Strong government actual path Developing, socialist countries Weak government Underdeveloped countries Few government services Many government services Fukuyama's additional dimension
Social construction of reality Coherence conception of knowledge Second order cybernetics Vienna Circle German Idealism Representation conception of knowledge Knowledge as an individual activity Knowledge as an group activity Two Paths to a Similar Outcome
Incommensurable Definitions Correspondence Principle Revolutionary Science The Dialectics of Science Normal Science
Author First Order Cybernetics Second Order Cybernetics Von Foerster Pask Varela Umpleby Umpleby The cybernetics of observed systems The purpose of a model Controlled systems Interaction among the variables in a system Theories of social systems The cybernetics of observing systems The purpose of a modeler Autonomous systems Interaction between observer and observed Theories of the interaction between ideas and society Definitions of First and Second Order Cybernetics (An example of incommensurable definitions)
The Correspondence Principle • Every new theory should reduce to the old theory to which it corresponds for those cases in which the old theory is known to hold • All the evidence that supported the old theory also supports the new theory • The principle requires adding a new dimension previously not considered
Old philosophy of science Amount of attention paid to the observer New philosophy of science An Application of the Correspondence Principle
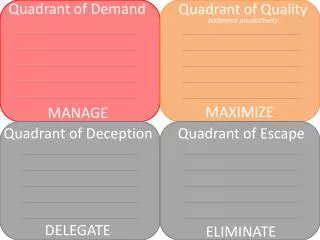
Why quadrant diagrams are useful • Quadrant diagrams are a way of creating a meta-analysis • They are a way of thinking abstractly about a large number of special cases • They focus attention on a few, ideally most important, dimensions • They help a regulator (manager) achieve requisite variety
Presented at a symposium organized by the Washington Evolutionary Systems Society within a meeting of the Washington Academy of Sciences held at the National Science Foundation Arlington, VA, March 25-26, 2006