Download
1 / 45
450 likes | 585 Vues
Computer Performance. Why Such Change in 10 years?. Performance Technology Advances CMOS VLSI dominates older technologies (TTL, ECL) in cost AND performance Computer architecture advances improves low-end RISC, superscalar, RAID, … Price: Lower costs due to … Simpler development

E N D
Why Such Change in 10 years? • Performance • Technology Advances • CMOS VLSI dominates older technologies (TTL, ECL) in cost AND performance • Computer architecture advances improves low-end • RISC, superscalar, RAID, … • Price: Lower costs due to … • Simpler development • CMOS VLSI: smaller systems, fewer components • Higher volumes • CMOS VLSI : same dev. cost 10,000 vs. 10,000,000 units • Function • Rise of networking/local interconnection technology
Technology Trends: Microprocessor Capacity Alpha 21264: 15 million Pentium Pro: 5.5 million PowerPC 620: 6.9 million Alpha 21164: 9.3 million Sparc Ultra: 5.2 million Moore’s Law • CMOS improvements: • Die size: 2X every 3 yrs • Line width: halve / 7 yrs
Memory Capacity (Single Chip DRAM) year size(Mb) cyc time 1980 0.0625 250 ns 1983 0.25 220 ns 1986 1 190 ns 1989 4 165 ns 1992 16 145 ns 1996 64 120 ns 2000 256 100 ns
Technology Trends(Summary) Capacity Speed (latency) Logic 2x in 3 years 2x in 3 years DRAM 4x in 3 years 2x in 10 years Disk 4x in 3 years 2x in 10 years
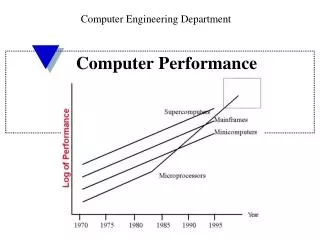
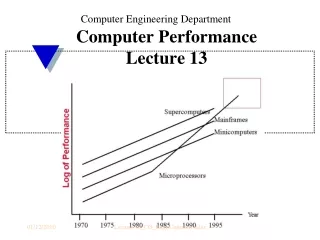
Processor PerformanceTrends 1000 Supercomputers 100 Mainframes 10 Minicomputers Microprocessors 1 0.1 1965 1970 1975 1980 1985 1990 1995 2000 Year
Performance Trends(Summary) • Workstation performance (measured in Spec Marks) improves roughly 50% per year (2X every 18 months) • Improvement in cost performance estimated at 70% per year
Measurement and Evaluation • Architecture is an iterative process: • Searching the space of possible designs • At all levels of computer systems
Computer Architecture Topics Input/Output and Storage Disks, WORM, Tape RAID Emerging Technologies Interleaving Bus protocols DRAM Coherence, Bandwidth, Latency Memory Hierarchy L2 Cache L1 Cache Addressing, Protection, Exception Handling VLSI Instruction Set Architecture Pipelining and Instruction Level Parallelism Pipelining, Hazard Resolution, Superscalar, Reordering, Prediction, Speculation, Vector, DSP
Computer Architecture Topics Shared Memory, Message Passing, Data Parallelism P M P M P M P M ° ° ° Network Interfaces S Interconnection Network Processor-Memory-Switch Topologies, Routing, Bandwidth, Latency, Reliability Multiprocessors Networks and Interconnections
Course Focus Understanding the design techniques, machine structures, technology factors, evaluation methods that will determine the form of computers in 21st Century Parallelism Technology Programming Languages Applications Interface Design (ISA) Computer Architecture: • Instruction Set Design • Organization • Hardware Operating Measurement & Evaluation History Systems
Computer Engineering Methodology Technology Trends
Computer Engineering Methodology Evaluate Existing Systems for Bottlenecks Benchmarks Technology Trends
Computer Engineering Methodology Evaluate Existing Systems for Bottlenecks Benchmarks Technology Trends Simulate New Designs and Organizations Workloads
Computer Engineering Methodology Evaluate Existing Systems for Bottlenecks Implementation Complexity Benchmarks Technology Trends Implement Next Generation System Simulate New Designs and Organizations Workloads
Measurement Tools • Benchmarks, Traces, Mixes • Hardware: Cost, delay, area, power estimation • Simulation (many levels) • ISA, RT, Gate, Circuit • Queuing Theory • Rules of Thumb • Fundamental “Laws”/Principles
DC to Paris Speed Passengers Throughput (pmph) 6.5 hours 610 mph 470 286,700 3 hours 1350 mph 132 178,200 The Bottom Line: Performance (and Cost) Plane Boeing 747 BAD/Sud Concodre • Time to run the task (ExTime) • Execution time, response time, latency • Tasks per day, hour, week, sec, ns … (Performance) • Throughput, bandwidth
The Bottom Line: Performance (and Cost) • "X is n times faster than Y" means • ExTime(Y) Performance(X) • --------- = --------------- • ExTime(X) Performance(Y) • Speed of Concorde vs. Boeing 747 • Throughput of Boeing 747 vs. Concorde
Amdahl's Law Speedup due to enhancement E: ExTime w/o E Performance w/ E Speedup(E) = ------------- = ------------------- ExTime w/ E Performance w/o E Suppose that enhancement E accelerates a fraction F of the task by a factor S, and the remainder of the task is unaffected
Amdahl’s Law ExTimenew = ExTimeold x (1 - Fractionenhanced) + Fractionenhanced Speedupenhanced 1 ExTimeold ExTimenew Speedupoverall = = (1 - Fractionenhanced) + Fractionenhanced Speedupenhanced
Amdahl’s Law • Floating point instructions improved to run 2X; but only 10% of actual instructions are FP ExTimenew= Speedupoverall =
Amdahl’s Law • Floating point instructions improved to run 2X; but only 10% of actual instructions are FP ExTimenew= ExTimeold x (0.9 + .1/2) = 0.95 x ExTimeold 1 Speedupoverall = = 1.053 0.95
Metrics of Performance Application Answers per month Operations per second Programming Language Compiler (millions) of Instructions per second: MIPS (millions) of (FP) operations per second: MFLOP/s ISA Datapath Megabytes per second Control Function Units Cycles per second (clock rate) Transistors Wires Pins
CPU time = Seconds = Instructions x Cycles x Seconds Program Program Instruction Cycle Aspects of CPU Performance Inst Count CPI Clock Rate Program X Compiler X (X) Inst. Set. X X Organization X X Technology X
Cycles Per Instruction “Average Cycles per Instruction” • CPI = (CPU Time * Clock Rate) / Instruction Count • = Cycles / Instruction Count Invest Resources where time is Spent! n CPU time = CycleTime * CPI * I i i i = 1 “Instruction Frequency” n CPI = CPI * F where F = I i i i i i = 1 Instruction Count
Example: Calculating CPI Base Machine (Reg / Reg) Op Freq Cycles CPI(i) (% Time) ALU 50% 1 .5 (33%) Load 20% 2 .4 (27%) Store 10% 2 .2 (13%) Branch 20% 2 .4 (27%) 1.5 Typical Mix
SPEC: System Performance Evaluation Cooperative • First Round 1989 • 10 programs yielding a single number (“SPECmarks”) • Second Round 1992 • SPECInt92 (6 integer programs) and SPECfp92 (14 floating point programs) • Compiler Flags unlimited. March 93 of DEC 4000 Model 610: • Third Round 1995 • new set of programs: SPECint95 (8 integer programs) and SPECfp95 (10 floating point) • “benchmarks useful for 3 years”
How to Summarize Performance • Arithmetic mean (weighted arithmetic mean) tracks execution time: (Ti)/n or (Wi*Ti) • Harmonic mean (weighted harmonic mean) of rates (e.g., MFLOPS) tracks execution time: n/(1/Ri) or n/(Wi/Ri) • Normalized execution time is handy for scaling performance (e.g., X times faster than SPARCstation 10) • But do not take the arithmetic mean of normalized execution time, use the geometric mean
Performance Evaluation • “For better or worse, benchmarks shape a field” • Good products created when have: • Good benchmarks • Good ways to summarize performance • Given sales is a function in part of performance relative to competition, investment in improving product as reported by performance summary • If benchmarks/summary inadequate, then choose between improving product for real programs vs. improving product to get more sales;Sales almost always wins! • Execution time is the measure of computer performance!
Integrated Circuits Costs IC cost = Die cost + Testing cost + Packaging cost Final test yield Die cost = Wafer cost Dies per Wafer * Die yield Dies per wafer = š * ( Wafer_diam / 2)2 – š * Wafer_diam – Test dies Die Area ¦ 2 * Die Area Die Yield = Wafer yield * 1 + Defects_per_unit_area * Die_Area } { Die Cost goes roughly with die area4
Real World Examples Chip Metal Line Wafer Defect Area Dies/ Yield Die Cost layers width cost /cm2 mm2 wafer 386DX 2 0.90 $900 1.0 43 360 71% $4 486DX2 3 0.80 $1200 1.0 81 181 54% $12 PowerPC 601 4 0.80 $1700 1.3 121 115 28% $53 HP PA 7100 3 0.80 $1300 1.0 196 66 27% $73 DEC Alpha 3 0.70 $1500 1.2 234 53 19% $149 SuperSPARC 3 0.70 $1700 1.6 256 48 13% $272 Pentium 3 0.80 $1500 1.5 296 40 9% $417 • From "Estimating IC Manufacturing Costs,” by Linley Gwennap, Microprocessor Report, August 2, 1993, p. 15
Average Discount Gross Margin Component Cost Cost/PerformanceWhat is Relationship of Cost to Price? • Component Costs • Direct Costs(add 25% to 40%) recurring costs: labor, purchasing, scrap, warranty • Gross Margin(add 82% to 186%) nonrecurring costs: R&D, marketing, sales, equipment maintenance, rental, financing cost, pretax profits, taxes • Average Discountto get List Price (add 33% to 66%): volume discounts and/or retailer markup List Price 25% to 40% Avg. Selling Price 34% to 39% 6% to 8% Direct Cost 15% to 33%
Chip Prices (August 1993) • Chip Area Mfg. Price Multi- Comment • mm2 cost plier • 386DX 43 $9 $31 3.4 Intense Competition • 486DX2 81 $35 $245 7.0No Competition • PowerPC 601 121 $77 $280 3.6 • DEC Alpha 234 $202 $1231 6.1Recoup R&D? • Pentium 296 $473 $965 2.0 Early in shipments • Assume purchase 10,000 units
Computer Architecture Is … the attributes of a [computing] system as seen by the programmer, i.e., the conceptual structure and functional behavior, as distinct from the organization of the data flows and controls the logic design, and the physical implementation. Amdahl, Blaaw, and Brooks, 1964 SOFTWARE
Computer Architecture’s Changing Definition • 1950s to 1960s: Computer Architecture Course Computer Arithmetic • 1970s to mid 1980s: Computer Architecture Course Instruction Set Design, especially ISA appropriate for compilers • 1990s: Computer Architecture CourseDesign of CPU, memory system, I/O system, Multiprocessors
Instruction Set Architecture (ISA) software instruction set hardware
Interface Design • A good interface: • Lasts through many implementations (portability, compatability) • Is used in many different ways (generality) • Provides convenient functionality to higher levels • Permits an efficient implementation at lower levels use time imp 1 Interface use imp 2 use imp 3
Evolution of Instruction Sets Single Accumulator (EDSAC 1950) Accumulator + Index Registers (Manchester Mark I, IBM 700 series 1953) Separation of Programming Model from Implementation High-level Language Based Concept of a Family (B5000 1963) (IBM 360 1964) General Purpose Register Machines Complex Instruction Sets Load/Store Architecture (CDC 6600, Cray 1 1963-76) (Vax, Intel 432 1977-80) RISC (Mips,Sparc,HP-PA,IBM RS6000, . . .1987)
Evolution of Instruction Sets • Major advances in computer architecture are typically associated with landmark instruction set designs • Ex: Stack vs GPR (System 360) • Design decisions must take into account: • technology • machine organization • programming langauges • compiler technology • operating systems
A "Typical" RISC • 32-bit fixed format instruction (3 formats) • 32 32-bit GPR • 3-address, reg-reg arithmetic instruction • Single address mode for load/store: base + displacement • no indirection • Simple branch conditions • Delayed branch see: SPARC, MIPS, HP PA-Risc, DEC Alpha, IBM PowerPC, CDC 6600, CDC 7600, Cray-1, Cray-2, Cray-3
Example: MIPS Register-Register 6 5 11 10 31 26 25 21 20 16 15 0 Op Rs1 Rs2 Rd Opx Register-Immediate 31 26 25 21 20 16 15 0 immediate Op Rs1 Rd Branch 31 26 25 21 20 16 15 0 immediate Op Rs1 Rs2/Opx Jump / Call 31 26 25 0 target Op
Summary, #1 • Designing to Last through Trends • Capacity Speed • Logic 2x in 3 years 2x in 3 years • DRAM 4x in 3 years 2x in 10 years • Disk 4x in 3 years 2x in 10 years • 6yrs to graduate => 16X CPU speed, DRAM/Disk size • Time to run the task • Execution time, response time, latency • Tasks per day, hour, week, sec, ns, … • Throughput, bandwidth • “X is n times faster than Y” means • ExTime(Y) Performance(X) • --------- = -------------- • ExTime(X) Performance(Y)
1 ExTimeold ExTimenew Speedupoverall = = (1 - Fractionenhanced) + Fractionenhanced Speedupenhanced CPU time = Seconds = Instructions x Cycles x Seconds Program Program Instruction Cycle Summary, #2 • Amdahl’s Law: • CPI Law: • Execution time is the REAL measure of computer performance! • Good products created when have: • Good benchmarks, good ways to summarize performance • Die Cost goes roughly with die area4 • Can PC industry support engineering/research investment?