Download

1 / 14
140 likes | 460 Vues
Geographic Units, Data Sources. 10-5-05. Geography Defined. Absolute / Relative locations Cartogram (fig 4.2) Geographic Research Areal or Spatial Association: florist shops in relation to high-rise office building Forms and Processes: process results in patterns

E N D
Geographic Units, Data Sources 10-5-05
Geography Defined • Absolute / Relative locations • Cartogram (fig 4.2) • Geographic Research • Areal or Spatial Association: florist shops in relation to high-rise office building • Forms and Processes: process results in patterns • Spatial Interaction: road network and traffic • Distance Decay: decreasing occurrence from center point. • Concepts in Geography • Direction • Distance • Scale • Location • Distribution: patterns, dispersion • Localization: spatial clustering • Functional Association: occurrence of objects as a response to the presence of other elements • Spatial Interaction – diffusion • The Regional Concept – a region is an internal homogeneity set it apart from others. • Concept of Change.
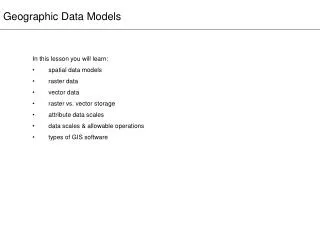
Spatial Dimensions • Forms: • Points • Line • Area • Volume • Space-Time • Discrete/Sequential/Continuous Phenomena • Discrete : integer numbers • Lines, cases make a sequential phenomena • Continuous: no gap between values, weight, time.
Measurement Scales (Table 4.3) • Nominal Scaling • Grouping, 0/1,A/B/C.. For identification purpose • Ordinal Scaling • Ranking, but ratio is not proportional • Interval Scaling • Numerical scores, no origin, any beginning point may be used. Fahrenheit temperature, relative ranking • Ratio Scaling • With known starting point, such as Kelvin temperature, elevation, weight
Remotely Sensed Data • Landsat (flying altitude, cycle, scenes/day) • SPOT • NETSAT
www.census.gov • Click Your Gateway to Census 2000 • Under American FactFinder, click “Enter a street address to find Census 2000 data” • Enter your home address, then press GO • Select a Geography (such as Census Tract) and Click “Map It” • Or click “Go”
GIS Census Data • Downloaded from http://arcdata.esri.com/data/tiger2000/tiger_download.cfm • Select TN • Under “Select by County” – choose “Putnam” • Under “Available data layers” – select • “Census Tract 2000” • “County 2000” • “Line Features -Roads” • Under “Available Statewide Layers” select • Census Tract Demographics (PL94) • Click “Proceed to Download” • Click “Download File” once the file is ready. • You will have to view the PL 94-171 Quick Reference Guide link to find out the field name and field description for the demographic data.
- Continued - • You will get 4 zip files plus one readme.html. • Unzip these four files (in fact, they are 3 shapefiles and 1 demographic data). Make sure you put them in same folder (you’d better create a data folder under your current working folder) • Start “ArcMap” from “Start” • Once the program started, you will be prompted to begin your program with “A new empty map” or other two options. Click OK to continue. • Click “Add Data” to add the following layers to the current project: tgr47141cty00.shp, tgr47141lkA.shp, tgr47141demtrt00.shp.
-- Continued -- • Add “Structure” and “Addresses” to your current project. • You might find the projection causing problem on one of the layer. If so, then defining the projection will take care of the problem.
Add and Join Data • Add tgr47000demtrt.dbf to your current project. • Join tgr47000demtrt.dbf to layer “tgr47141trt00” • Right-click on the “tgr47141trt00” and choose “Joins and Relates/Joins” • Join is based on “STFID” from this layer and “tgr47000demtrt” • Click “Advanced” and select the second options “Keep only matching records”. Clikc OK to continue.
Homework 4 – 1due : 10-19-2005 midnight • Download your county data (2000 County, Block Group 2000, Demographics (SF1), Line Features - Roads) • Join Table from tgr47000sf1grp.dbf to your county’s block group by “Stfid” (see instruction on the link) • Plot your county based on the population (field name POP2000) using 3 classes. • Save your project as HW4-yourname.mxd under your homework folder. • Send email to me with link to your homework mxd
Homework 4 - 2 • Find population of your hometown from www.census.gov. (1990,2000,2003) • Find all the Metropolitan Statistical Areas or Micropolitan Statistical Areas of Tennessee. The followings are required components for your homework: • Definition of MSA • Type in an Excel spreadsheet with information such as County (may have more than one), population 1990 and 2000, percent change between 1990 and 2000. • Turn in a printed copy of the homework. • Plot MSA (Metro and Micro) on Tennessee County Map (Geo Major) with proper legend, shading, symbols and layout. Print maps with colors or simply send me the link (remember to save all your layers to your G drive, not C drive)