Download
1 / 27
270 likes | 479 Vues
Ratio Transformation for Stationary Time Series with Special Application in Consumer Price Index in Qatar. By: Adil Yousif , Hind Alrkeb , Doha Alhashmi Department of Mathematics and Statistics Qatar University Doha, Qatar. Abstract.

E N D
Ratio Transformation for Stationary Time Series withSpecial Application in Consumer Price Index in Qatar By: AdilYousif, Hind Alrkeb, Doha Alhashmi Department of Mathematics and Statistics Qatar University Doha, Qatar
Abstract This article was intended to perform a comprehensive time series analysis for Consumer Price Index (CPI) in Qatar. The data was obtained from the Statistics Authority in Qatar. For the period between: (2002-2009) a quarterly data was analyzed using several time series techniques such as Exponential Trend method, Holts’ Trend method, and ARIMA. These methods were used to examine trends and built a forecast model. Ratio transformation technique was used to obtain a stationary time series and found to be efficient with small size of data. Despite the small size of the data the analysis indicated that ARIMA model is more adequate forecast one. Key words: Time series, index, CPI, ARIMA, Ratio Transformation
Introduction • Qatar witnessed a tremendous increase in the economy in the last decade. • The economic policy in Qatar is moving towards economic diversifications through investing the returns of oil and gas in profitable projects. • In addition to that, the state adopts new methodologies in economic and trade liberalization to attract foreign investments and strengthen the private sector.
The GDP has increased rapidly during the last period. It reached 268 billion Qatari Riyals (73.4 billion US Dollar) in 2009 as per the estimation of Statistics Authority. The growth rates of the GDP during last three years were 34%, 13%, and 15% in the years 2006, 2007 and 2008 respectively. As Qatar’s economy is in the booming phase, the prices level increased rapidly during last years as a result of expanding in the Building & Construction sector. This expansion caused inflation in rent rates, and hence affected the prices level in Qatar
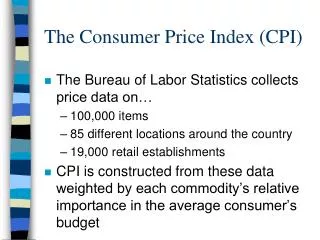
Index Number • The index number is defined as a statistical indicator expresses the proportional change in value of specific phenomenon or group of phenomena compared to specific base. • When the change is over the time the previous period is called the base period, where as the measured period is called the comparison period. Several methods are used to calculate the index number and some of them are discussed below.
Laspere’s index number • It is assumed within this index that individuals will consume, in the new period and in the shadow of change in prices, the same original group of goods, weighted by base year quantities, as shown in the following equation:
Paasche’s index number • This index is based on an assumption differs from Laspere’s assumption, which is, individuals will consume in the new period and in the shadow of change in prices, a new group or quantities of goods for each year separately, provided that prices are weighted by comparison year quantities, as shown in the following equation:
Fisher’s optimum index number • It is the index which comprises the Laspere’s index and the Paasche’s index by finding the geometric mean of both numbers, as shown in the following equation:
Collecting Price Data • The Statistics Authority in Qatar is the only official body responsible of collecting data in the country. • Price data were collected through personal interview by the trained data collectors. • Data collection is carried out by registering prices from shelves of commercial stores( trade malls, etc). • Or through personal interview with establishment managers education centers, clinics, real estate bureaus, government establishments,…etc). • Each data collector has been provided with questionnaire for each group of prices and sources of each questionnaire. • The data were collected quarterly for the period of 2002-2009 with the base year considered to be 2001. • After price data sets are collected, it will be audited at the office and entered to the computer, and then the average price and consumer prices index number are calculated. Laspere’s formula was used to calculate the index number weighted by 2001 prices.
Methodology • The original data was used to fit the exponential trend and the Holts Winter model. • Since ARIMA requires a stationary set of data and the original data is violating this condition transformation was used. • The traditional difference transformation was used and the third difference yield in a stationary set. • Since the data is relatively small a new approach of transformation in which ratios was considered to avoid the loss in the sample size as a result of several differences. Results of the two transformation methods are almost identical see table
ARIMA • When using this transformation with first order autoregressive model • It becomes: • Which eliminate the constant terms and the random shock term will be a multiple of the response variable. The final model will be
Ratio for ARIMA • When the ratio transformation ( ) to the first order moving average model is used • Substituting the ratio form we get: • Which involve the response variable directly unlike the original model, however the constant term is again eliminated
Double Exponential Smoothing • Double exponential smoothing technique was introduced by Holt (and Brown as a special case) smoothes the data. • Double exponential smoothing provides short-term forecasts. • This procedure can work well when a trend is present but it can also serve as a general smoothing method.
Both exponential trend method and Holts’ Double Exponential Smoothing were used and the last outperformed the first when their MADs are compared. Figure [3] shows the fitted values versus actual values and one year ahead of forecast together with their 95% prediction interval for the Holt’s exponential model. It appears that there is an increasing trend in the Household variable with a MAD (1.21962). The one year a head forecasts of this model are displayed in table [1]
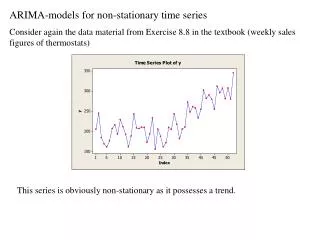
Auto Regressive Integrated Moving Avareg (ARIMA) • The data shows an exponential trend in the time series plot, without seasonal variation , so we can apply non-seasonal ARIMA model. • The analysis of the time series of the CPI is conducted by using MINITAB version 16.0. After the examination of the behavior of the sample autocorrelation (SAC) function and partial autocorrelation (SPAC) function for the regular difference transformation data. • Referring to figures [4] and [5], it can be concluded that the data became stationary after the third difference. It can also be observed that both of the SAC and SPAC cut off after lag 1.
ARIMA • However, since the SPAC cut off more fairly quickly, we tentatively identify the non-seasonal autoregressive model of order 1. • The ARIMA for this data shows that the two parameters in the AR model of order 1 have p -value less than 0.05. This implies that we have very strong evidence that each term in this is important since can be rejected at the significance level α equals to 0.05.
Also from the table [1] it can be noticed that Ljung-Box test has a p –value associated with for lags K = 12 and K = 24 are both greater than 0.05. Hence, it can be concluded that model is adequate. Moreover since =0.4095 < 1 then the third difference data is stationary. Modified Box-Pierce (Ljung-Box) Chi-Square statistic
Ratio Transformation • For the ratio transformation the sample autocorrelation function dies cuts off after lag 1, whereas the partial autocorrelation dies in a dammed fashion and a suggested model is a moving average of order 1. • The p-values for the two parameters are 0.000 which implies they are significantly different from zero. From table [2] below the Ljumg-Box test has p-values at lag K =12 and K=24 equal to 0.000 and therefore we can confidently say the model MA of order 1 is adequately fit the ratio transformation data. The invertibility condition is also satisfied since
Forecast • The forecasts for one year ahead, (2010) for the three models along with actual values (obtained from Qatar Statistical Authority) are then compared and listed in the table [3] below. • The ARIMA model for the ratio transformation data has the best estimates followed by the ARIMA model for the regular transformation data. • Although the Holt’s exponential model is less accurate than ARIMA still its error forecast is very small and its predicted values are not far from the actual ones.
Conclusion • From time series analysis it appeared Double Exponential Smoothing model is better than exponential trend model since the values of MAD and MSD in Double Exponential Smoothing are smaller. • On the other hand ARIMA was used for two different sets of data and both of them provided forecasts more accurate than the Double Exponential Smoothing model. • For the ARIMA in the first set the regular difference transformation was used and a third difference yield into a stationary time series, while in the second set the ratio difference was used for the purpose of preventing the decrease the sample size due to more than one differences. • The ARIMA model for the ratio transformation produced more accurate forecast.
References • [1] Aka, B. F. and Pieretti, P., Consumer Price Index Dynamics in a Small Open Economy: Structural Time Series Model for Luxembourg, International Journal of Applied Economics, 5910, p 1-13, 2008. • [2] Bascand G., Product Price Index: June Quarter Highlights, Statistics New Zealand, ISSN 1178-0622, 2009 • [3]Bulletin of Prices Index Numbers 2006 -5th Issue July 2007 • [4] Bower B., O’Conell R. and Koehler A., Forecasting Time Series and Regression: An Applied Approach • [5] Bowles, T. J. and Cris Lewis, W., A Time Series Analysis of the Medical Care Price Index: Implication for Appraising Economic Losses, Journal of Forensic Economics 13(3), pp 245-254, 2000. • [6] Box G., Jenkins G. and Reinsel G., Time Series Analysis: Forecasting and Control. Prentice Hall. • [7] US Bureau of Labor Statistics: Response Rate for the Consumer Price Index: Consumer Price index Program, Report 2004