Download
1 / 53
540 likes | 653 Vues
Some maternal and child health issues in Chile. Dr. Francisco Mardones Public Health Department Faculty of Medicine Pontifical Catholic University of Chile (Pontificia Universidad Católica de Chile). Population and birth statistics. Population and birth statistics.

E N D
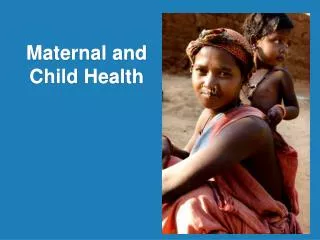
Some maternal and child health issues in Chile Dr. Francisco Mardones Public Health Department Faculty of Medicine Pontifical Catholic University of Chile (Pontificia Universidad Católica de Chile)
Population and birth statistics Global situation: The highest values are from Japan (81.0), Monaco (80.5) and Andorra (80.4), while the lowest are found in Sierra Leona (37.9) and Malawi (37.8). Situation in Latin America: Chile (77.4), Costa Rica (77.3) and Cuba (76.7) have the highest values, while Bolivia (63.6) and Haiti (59.2) have the lowest ones.
Live births distribution according to place of delivery. Chile, 2005
Live births distribution according to birth weight. Chile, 2005
Live births distribution according to birth weight. Chile, 2005
Live births distribution according to length at birth. Chile, 2005
Live births distribution according to weeks of gestation at delivery. Chile, 2005.
Live births distribution according to mother´s level of education. Chile, 2005.
Live births distribution according to mother´s employment. Chile, 2005.
Live births distribution according to father´s level of education. Chile, 2005.
Live births distribution according to father´s employment. Chile, 2005.
Live births distribution according to the presentation of single and multiple pregnancy. Chile, 2005.
Live births distribution according to professional in charge at delivery. Chile, 2005.
Mortality rates in children of ages 1 to 4, according to birth weight. Chile, 2005.
Mortality rates according to birth weight. Chile, 2005. • Data on stillbirths is available, but it is not presented here. • Prevention of LBW babies in Chile. Recent proposals: Improved food fortification during pregnancy. (Mardones F, Urrutia MT, Villarroel L, Rioseco A, Castillo O, Rozowski J, Tapia JL, Bastias G, Bacallao J, Rojas I. Effects of a dairy product fortified with multiple micronutrients and omega-3 fatty acids on birth weight and gestation duration in pregnant Chilean women. Public Health Nutr. 2008; 11 (1): 30-40. Improving neonatal care. (Mardones F, Marshall G, Viviani V, Villarroel L, Burkhalter BR, Tapia J-L, Cerda J, García-Huidobro T, Ralph C, Oyarzún E, Mardones-Restat F. Estimation of Individual Neonatal Survival Using Birthweight and Gestational Age: a Way to Improve Neonatal Care. J Health Popul Nutr 2008; 26 (1): 54-63.
How to improve neonatal care? Mardones F, et al,. Estimation of Individual Neonatal Survival Using Birthweight and Gestational Age: a Way to Improve Neonatal Care. J Health Popul Nutr 2008; 26 (1): 54-63.
Population and birth statistics • In Chile, the nutrition transition has taken place at a unique rate. In two decades undernutrition has practically disappeared, leaving instead high obesity figures in all age groups (Albala C et al. Public Health Nutr 2002;5:123-28). • Obesity prevalence in the Chilean adult population was surveyed in year 2003 reaching 23.2% at the national level. Mardones F et al. Early Hum Dev 2007;83(Suppl 1):S162).
Population and birth statistics • Chilean children attending first grade primary education in public schools have increased the obesity prevalence estimated with CDC standards from 17% in year 2001 to 19.4% in year 2006 (Ministry of Education. http://sistemas.junaeb.cl/estadosnutricionales_2007/index2.php).
Comparison of data from Chile with data from two provinces. 2003 & 2004 **2003 *2004 Ministry of Health.
Nutritional deficits in poor areas: Pregnancy data in two provinces.
Nutritional deficits in poor areas: Pregnancy data in two provinces.
Nutritional deficits in poor areas: Pregnancy data in two provinces.
Nutritional deficits in poor areas: Pregnancy data in two provinces.
Nutritional deficits in poor areas: Pregnancy data in two provinces.
Nutritional deficits in poor areas: Pregnancy data in two provinces.
Pre-eclampsia in Chile • Preterm labor, low birth weight and maternal preeclampsia are major causes of maternal and neonatal morbidity and mortality and are all interrelated (Rush 1976, Arias 1982, Van den Berg 1984, McIntire 1999, Donoso 1999 Donoso 2004, Lawn 2005, Bhutta 2005). • Preeclampsia is the most frequent hospitalization diagnosis in obstetrics, and this has not changed significantly in the last decades (Oyarzun 1995, Neira 1997).
Pre-eclampsia in Chile • It is estimated that preeclampsia, including chronic hypertension, affects around 10-12% pregnant women in Chile and universally (Neira 1997, Sibai 1998). • Maternal hypertensive disorders are the most frequent cause of maternal mortality in Chile and are also associated with preterm delivery and with intrauterine growth restriction (Oyarzún 1995, Donoso 1999, Donoso 2004).
Pre-eclampsia in Chile • No effective therapeutic intervention has been found to avoid or decrease the prevalence of this complication of pregnancy. We have recently reported an experiment showing a possible incidence reduction(Mardones et al 2008, to be shortly presented on Friday). • Paliative measures, such as inhibition of uterine contractility, the use of bed rest, oxygen or antihypertensive drugs have not modified the prevalence or the course
Pre-eclampsia in Chile • In 515 pregnant women from the Arauco province that included both primigravid and multiparae showed a 13.0% incidence of preeclampsia; 43% of these women had chronic hypertension. (Mardones F et al 2005). • This preeclampsia incidence is substantially higher than the incidence observed in a survey from a big maternity hospital in Santiago, Chile: among 28,000 deliveries, preeclampsia was diagnosed in 8.5%, in both primiparae and multiparae women; 25% had chronic hypertension.
Maternal nutritional status in Chile • During the period of 1987-2001, underweight pregnant women and birth weight < 3000 g decreased; these declines have been associated with better living conditions (Mardones F et al. Mat & Child Nutr 2005; 1 (2): 77-90). • In 1987 the incidence of birth weight under 3000 g was 26.4%. A huge decline occurred between 1987 and 1990; after that it has been hovering around 20%. • In fact, between 1990 and 2005 the proportion of BW < 3000 g is rather stable: 22.5% in year 2005.
Maternal nutritional status in Chile • On the other hand, Chile had a national incidence of 6.05% for birth weight 4000 g in 1987 and 10.7% in 2001; nowadays is slightly over 9%. Over the same period of time the estimated proportion of obese pregnant women in the public health system has increased from 12.9% in 1987 to 32.6% in 2001. • Pre-term deliveries < 37 w are slightly increasing.
Maternal nutritional status in Chile • Different studies have established that anemia in the earliest stages of pregnancy is a public health issue in Chile. The most recent study done in Concepción province (Mardones F et al, ALAN, approved for publication, 2008) showed a prevalence of 14,5%, similar to a prevalence of 13,4% recently observed in Santiago (Mardones F et al. 2004). • The prevalence of anemia in the province of Arauco and other poor areas has not been yet published. We are just finishing a study in Arauco province.
Descriptive Statistics of pregnant women delivering in the Sotero del Rio Hospital (Santiago, S-E Health Area) 2001-2004.
Maternal reproductive history Hospital Sotero del Rio, Santiago 2001 2004.
Descriptive Statistics of pregnant women delivering in the Sotero del Rio Hospital (Santiago, S-E Health Area) 2001-2004.
We compared birthweight distributions from the same hospital. Healthy subjects were compared to the total sample. • A recent technical report from the World Health Organization has proposed the development of birth weight references for each population based on observations of low-risk healthy pregnant women and their neonates (Promoting optimal fetal development. Geneva: WHO, 2006). We report a comparison of birth weight distributions from newborns delivered by pregnant women in Santiago, Chile.
Women delivering single pregnancies at week 39-41, without pathologies or behaviors that may affect fetal growth were selected as healthy population (Mardones F et al. Early HD 2006; 82 (8): 512). • A total of 28,897 newborns were studied. Healthy selected pregnancies resulted in 12,300 newborns. In the total sample mean birth weight was 3,314 ± 586 g, skewness -1.065, and kurtosis 3.299. In the healthy population mean birth weight was 3,505 ± 413 g, skewness 0.198 and kurtosis 0.705.
Distribution of all newborns according to birth weight in Sótero del Río Hospital (Chile, 2000-2004).
Distribution of healthy term newborns according to birth weight in Sótero del Río Hospital (Chile, 2000-2004).
A higher concentration of preterm births and specific maternal pathologies in the total population is interpreted as the cause for the observed skewness to the left in the birth weight distribution. Birth weight distribution of the healthy selected pregnancies was normal and it can be considered as an adequate standard for the population of newborns studied. Therefore this reference distribution might be an adequate target for health interventions
Bodymassindex (BMI) and gestionalage: chart to guide weightgainduringpregnancy (Mardones F, Rosso P. A weight gain chart for pregnant women designed in Chile. Maternal and ChildNutrition 2005; 1 (2): 77-90.
Pregnant women distribution according to Nutritional Status at the beginning of pregnancy. Santiago, S-E Health Area, 2001-2004.
Pregnant women distribution according to Nutritional Status at the beginning of pregnancy. Santiago, S-E Health Area, 1983-1985.
Pregnant women distribution according to Nutritional Status at the end of pregnancy. Santiago, S-E Health Area, 2001-2004.
Pregnant women distribution according to Nutritional Status at the end of pregnancy. Santiago, S-E Health Area, 1983-1985.
Mardones F et al. Association of perinatal factors and obesity in 6-8 years old Chilean children. Int J Epidemiol 2008;37:902–10. • 153,536 children entered the study. • Adjusted OR for perinatal information showed that infants born male, premature and short in length at birth were more prone to obesity than their counterparts. • However, birth weight had a stronger positive influence on obesity risk.