Download
1 / 13
130 likes | 359 Vues
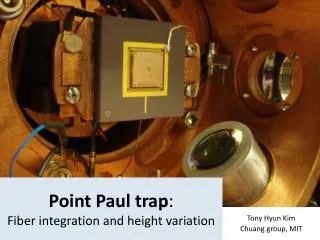
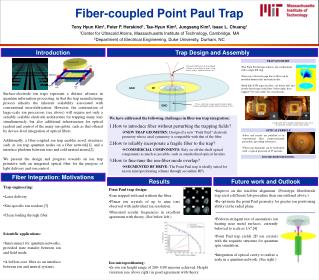
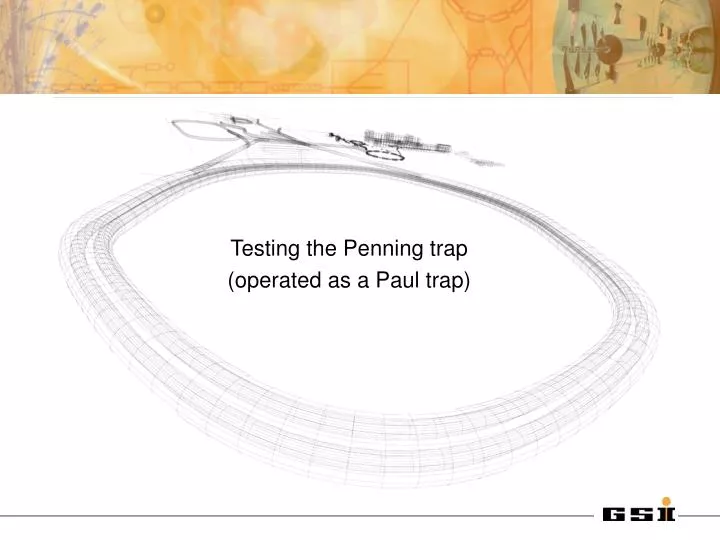
Testing the Penning trap (operated as a Paul trap). endcap. ring. endcap. DC. trap potential. +. -. RF. ~. bias potential. +. DC. -. ground. Trap T est - The Experimental Setup. -3 k V. +250 V. 100 e V. Faraday cup. Einzel lens. Ar + source. Trap testing:

E N D
Testing the Penning trap (operated as a Paul trap)
endcap ring endcap DC trap potential + - RF ~ bias potential + DC - ground Trap Test - The Experimental Setup -3kV +250 V 100 eV Faraday cup Einzel lens Ar+ source Trap testing: • Vary the trapping time • Vary the trapping voltages • Monitor the ion count pA Capturing and storing Detection Zoran Anđelković
Overview of the System Trap and optics voltage supplies Measuring cycle Channeltron Zoran Anđelković
First Results • Dependence on thetrap voltage as expected • Strong dependence on RF amplitude az ~ Vdc Bias Voltage: 37 V Trapping time 2 s RF apmpitude 300 V (1 MHz) Detected number of ions qz ~ RF amplitude Trap voltage [V] Paul trap stability diagram Zoran Anđelković
Trap Test - Results Trap voltage: 10 V Bias voltage 71 V RF apmpitude 300 V (1 MHz) Detected number of ions • Exponential decay expected • Storage time vs. ion count – “dead time” problems • Good results at low ion counts Zoran Anđelković
Laser - An Overview of an ECDL • External Littrow resonator • Single mode operation • Simple and fast constr-uction • Cheap components Zoran Anđelković
Laser Linewidth Measurements • Laserand FPI linewidth convolution • Sutalble for most applications Zoran Anđelković
Laser Locking and Stabilization to experiment LASER Faraday rotator Variable attenuator PD 1 PD 2 ReferenceFPI Differential amplifier Simulated by reference electronics Zoran Anđelković
Laser Setup Overview • Successful locking for more than 30 min. • Up to 2 GHz scanning range • Scannable Zoran Anđelković
Locking Stability • Laser in lock – error signal driftsaround the zero • Out of lock – error signal driftsrandomly Zoran Anđelković
Spectroscopy Test Thermal Li atom source • Results: • fluorescence at 671 nm • two hyperfine components The assembled laser system Zoran Anđelković
Improvement and Outlook Further improvement: • Locking of the FPI to a He-Ne • Broader (mode-hop free) scanning rang • Test – spectroscopy inside the trap Implementation: • Penning trap under construction at GSI • Operation of the laser system with different wavelengths (laser diodes) • First SPECTRAP experimentsexpected during 2009 Zoran Anđelković