Download
1 / 21
220 likes | 502 Vues
Chapter 12: Inference for Proportions. 12.1 Inference for a Population Proportion 12.2 Comparing Two Proportions. Sampling Distribution of p-hat. From Chapter 9: p-hat is an unbiased estimator of p. standard deviation of p-hat:. Figure 12.1, p. 687.

E N D
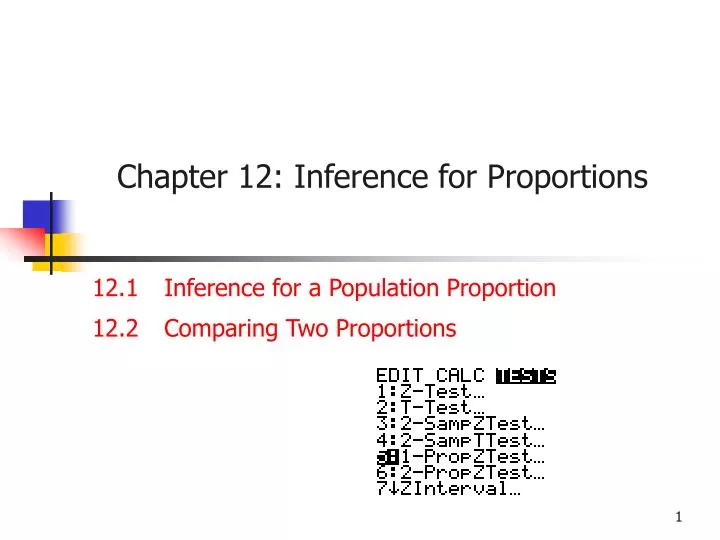
Chapter 12: Inference for Proportions 12.1 Inference for a Population Proportion 12.2 Comparing Two Proportions
Sampling Distribution of p-hat • From Chapter 9: • p-hat is an unbiased estimator of p. • standard deviation of p-hat:
Conditions for Inference abouta Proportion (p. 687) • SRS • N at least 10n • For a significance test of H0:p=p0: • The sample size n is so large that both np0 and n(1-p0) are at least 10. • For a confidence interval: • n is so large that both the count of successes, n*p-hat, and the count of failures, n(1 - p-hat), are at least 10.
Can we make inferences about a proportion? • Exercises 12.4 and 12.5, p. 689
Normal Sampling Distribution • If these conditions are met, the distribution of p-hat is approximately normal, and we can use the z-statistic:
Inference for a Population Proportion • Confidence Interval: • Significance test of H0: p=p0:
Practice • Exercise 12.7, p. 694
Homework • Read all of 12.1 (pp. 684-697) • Exercises: • 12.14, 12.15, p. 698
Choosing a Sample Size (p. 695) • Our guess p* can be from a pilot study, or we could use the most conservative guess of p*=0.5. • Solve for n. • Example 12.9, p. 696.
Practice • Exercises: • 12.10, p. 696 • 12.8, p. 694
Homework • Reading, Section 12.2: • pp. 702-713
Conditions: Confidence Intervals for Comparing Two Proportions • SRS from each population • N>10n from each population • All of these are at least 5:
Calculating a Confidence Interval for Comparing Two Proportions (p. 704) • Two prop: • Remember the one-prop formula:
Practice Problem • 12.23, p. 706
Significance Tests forComparing Two Proportions • Example 12.12, p. 707 • H0: p1=p2 vs. Ha: p1<p2 • “If H0 is true, all observations in both samples really come from a single population of men of whom a single unknown proportion p will have a heart attack in a five-year period. So instead of estimating p1 and p2 separately, we pool the two samples and use the overall sample proportion to estimate the single population parameter p.
Significance Tests forComparing Two Proportions • The test statistic is: • Where,
Conditions: Significance Test for Comparing Two Proportions • SRS from each population • N>10n from each population • All of these are at least 5:
Practice Problem • 12.25, p. 712
Practice • Problems: • 12.36, p. 720 • 12.37, p. 720 • 12.41, p. 721 • Chapter 12 test on Monday • Formulas provided: