1 / 2

Venn Diagrams pg. 51

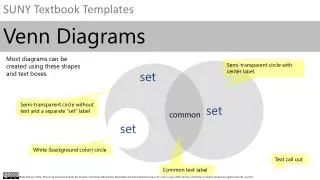
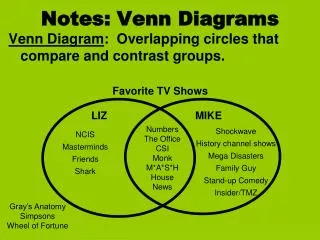
Venn Diagrams pg. 51. A Venn Diagram is a tool used to classify objects. It is usually composed of two or more circles that represent different conditions. An item is placed in the Venn diagram in the appropriate position based on the conditions it meets. Example:.

Télécharger la présentation

Venn Diagrams pg. 51

An Image/Link below is provided (as is) to download presentation Download Policy: Content on the Website is provided to you AS IS for your information and personal use and may not be sold / licensed / shared on other websites without getting consent from its author. Content is provided to you AS IS for your information and personal use only. Download presentation by click this link. While downloading, if for some reason you are not able to download a presentation, the publisher may have deleted the file from their server. During download, if you can't get a presentation, the file might be deleted by the publisher.

E N D

Presentation Transcript


  1. Venn Diagrams pg. 51 • A Venn Diagram is a tool used to classify objects. It is usually composed of two or more circles that represent different conditions. An item is placed in the Venn diagram in the appropriate position based on the conditions it meets.

  2. Example:

More Related