Download
1 / 20
200 likes | 310 Vues
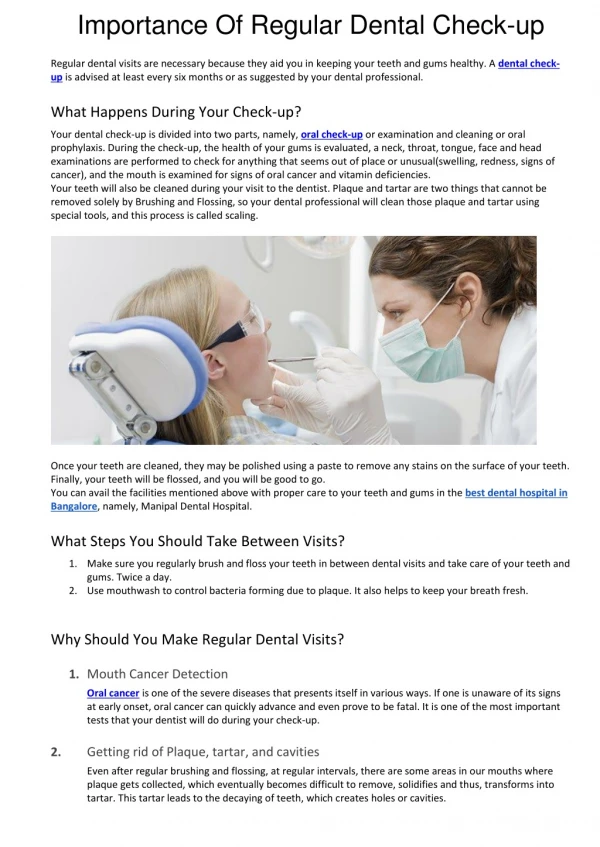
An Effective Dental Practice Performance Check-up. H. Jack Stockton, DMD, CFP, MBA, FICD Box 478 St. Pierre-Jolys, MB R0A 1V0 Phone: (204) 433-3292 Email: jack_stockton@umanitoba.ca. Practice Performance vs Practice Success.

E N D
An Effective Dental Practice Performance Check-up H. Jack Stockton, DMD, CFP, MBA, FICD Box 478 St. Pierre-Jolys, MB R0A 1V0 Phone: (204) 433-3292 Email: jack_stockton@umanitoba.ca
Practice PerformancevsPractice Success • Practice performance is measured by comparing your practice to industry norms. • Practice success is achieving your personal goals. • You don’t have to “keep up with the Jones” to be successful. H. J. STOCKTON
Performance Measures to Be Discussed • Revenue data • Expense data • Return on investment • Patients/new patients data • Recall system effectiveness • Accounts receivable control H. J. STOCKTON
Revenue Data • G.P. Gross billings vary significantly depending on: • Type of practice – with or without hygienists/associates. • Regional variations. • Dentist’s age/years since graduation. H. J. STOCKTON
Revenue Mix • Average AB mix for family practice with hygienist(s): • Dentist(s) = 62% • Lab = 8% • Hygiene/CDA = 30% • But, depends on type of practice: • Preventive vs restorative • Children vs adults H. J. STOCKTON
Expense Data • Wide variations in overhead. • G.P. total overhead averages 60-65%. • Operating overhead % (excludes financing and depreciation) is a more useful performance indicator. • <55% operating overhead is good. • Specialty endo & O.S. practice overheads are significantly lower. H. J. STOCKTON
Expense Data (cont’d) • Use managerial accounting and divide expenses into fixed and variable • Have a separate category for staff wages, the largest expense - (mostly fixed, some variable) • Next 3 largest expenses are: • Lab (variable) • Dental supplies (variable) • Rent (fixed) H. J. STOCKTON
Expense Data (cont’d) • G.P. averages (as % of revenue): • Staff wages 20-32% • Lab 7-10% • Dental supplies 6-9% • Rent 5-6% • All other operating expenses 10-13% H. J. STOCKTON
Staff Wages • To assess properly, must exclude dentists’ compensation & adjust family member’s wages to market. • Average staff payroll for G.P. Practices is 25-27% of revenue. • Normal variation can be 18-35%, depending on revenue mix. • Expect staff payroll % to be higher with more hygiene and less lab billings. H. J. STOCKTON
Staff Wages • Refer to ADA&C Practice Management Manual for expected staff wages for different revenue mixes. H. J. STOCKTON
Return on Investment • Measure of profitability. • Excellent indicator of practice efficiency • Two measures • Return on assets (most useful) • Return on equity H. J. STOCKTON
Return on Investment (ROI) • An owner-operator dentist should be remunerated in 3 ways: • For professional dental services • For management skill & effort • For capital investment in practice (ROI) H. J. STOCKTON
Return on Investment Reported practice net income (adjusted) less, Professional remuneration less, Management remuneration -------------------------------------------- Return on investment (ROI) H. J. STOCKTON
Patients/New Patients Data(Urban GP Practices) • Average no. of “active” patients (seen within 2 yrs.) = 1,200 – 1,800 • Average no. of “regular” patients (seen within 1 yr.) = 850 – 1,300 • Average no. of new patient exams per month = 12 - 18 H. J. STOCKTON
Recall System Performance Indicators(Urban GP Practices) • Average no. of recalls per month = 90 – 120 per full-time dentist. • AB hygienist billings (excluding exams) average ~ 30% of gross. • Average % of patients on regular recall is only 50-60% of total patient base. H. J. STOCKTON
Recall System Efficiency Calculation(% of patients on regular recall) = Average recall frequency X no. of recalls/mo. Total no. of active patients H. J. STOCKTON
Accounts Receivable Control • Average A/R 6-8% of annual gross (3-4 weeks billings) • Average bad debts ~ 1% of annual gross • Average accounts over 90 days ~ 15% of A/R. H. J. STOCKTON
Other Useful Data to Monitor • Missed/cancelled/open appointments. • Sources of new patient referrals. • Patient referrals • Staff referrals • Other professionals’ referrals • Advertising • Location • Other sources • Re-treatment costs (especially with associates). H. J. STOCKTON
Solutions to Revenue Problems • Add staff/dentists (if saturated) • Marketing • Internal • External • Improve recall system/patient retention • Improve diagnosis and treatment planning • Improve case presentation/acceptance H. J. STOCKTON
Solutions to Revenue Problems(continued) • Improve clinical ability • Range of skills • Efficiency • Improve appointment book control • Improve productive capacity of facility • Improve staff selection/management • Raise fees • Relocation (if unlikely to increase revenue) H. J. STOCKTON