Download
1 / 20
200 likes | 308 Vues
Key Features of Milton Keynes. Population: 207,060Fast Growth90% born in UK71% Christian14% Limiting Long Term Illness7% General health Not Good'17,400 Providing Unpaid Care. Ethnicity. Very Important new dataMilton Keynes as a wholeAge and EthnicityEducation and EthnicityEconomic Activi

E N D
1. Census Data on Equalities Ethnicity
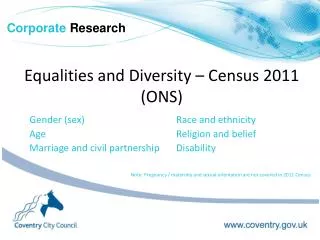
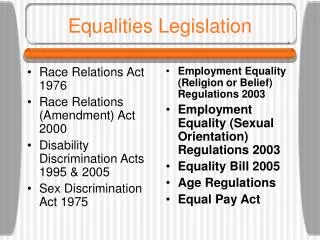
Religious background
Age
Education
Economic Activity
Disability
Tenure Good morning, it is nice to meet you all. I have been asked here today by the Equalities Action group, to talk to you about equalities, inequalities, and the data we have from the 2001 Census which can help identify different forms of inequality. It must be emphasised that this gives a snapshot of the situation, as at census day, which was 29th April 2001.Good morning, it is nice to meet you all. I have been asked here today by the Equalities Action group, to talk to you about equalities, inequalities, and the data we have from the 2001 Census which can help identify different forms of inequality. It must be emphasised that this gives a snapshot of the situation, as at census day, which was 29th April 2001.
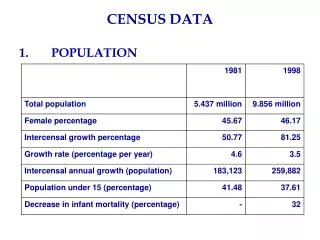
2. Key Features of Milton Keynes Population: 207,060
Fast Growth
90% born in UK
71% Christian
14% Limiting Long Term Illness
7% General health �Not Good�
17,400 Providing Unpaid Care So the census indicated that Milton Keynes had a population of 207,060 in 2001. It was the fastest growing area in the South East region, and one of the fastest in the country, growing by 28,800 people since 1991 � an amazing growth of around 16%! 90% of the population were born in the UK. 71% of those who gave a religious group were Christian. 14% or 29,104 people said that they had a limiting long term illness. 7%, or 14,719 people classed their general health as �not good�. 17,400 people were also providing unpaid care, of whom 3487 were providing unpaid care for over 50 hours per week.So the census indicated that Milton Keynes had a population of 207,060 in 2001. It was the fastest growing area in the South East region, and one of the fastest in the country, growing by 28,800 people since 1991 � an amazing growth of around 16%! 90% of the population were born in the UK. 71% of those who gave a religious group were Christian. 14% or 29,104 people said that they had a limiting long term illness. 7%, or 14,719 people classed their general health as �not good�. 17,400 people were also providing unpaid care, of whom 3487 were providing unpaid care for over 50 hours per week.
3. Ethnicity Very Important new data
Milton Keynes as a whole
Age and Ethnicity
Education and Ethnicity
Economic Activity and Ethnicity
Dispersal of ethnic groups So when looking at the first area, of ethnicity, the importance of the 2001 Census data cannot be understated. Milton Keynes does have some information on the ethnic makeup of the population from the school census data, which is a good source to pick up new ethnic groups moving to Milton Keynes. However this is the first reliable source of data about the whole population since the 1991 census. As Milton Keynes is one of the fastest growing areas in the country, it is particularly important. So I will first talk about what this new data tells us about ethnicity in Milton Keynes as a whole. This will include both the ethnic makeup of the Borough, and some important data which are only available at Borough level. This includes data on the age profile of different ethnic groups, and data on levels of qualification by ethnic group. We also have information about the levels of economic activity by ethnic group. I�ll then move on to describe the dispersal of various ethnic groups within the Borough.So when looking at the first area, of ethnicity, the importance of the 2001 Census data cannot be understated. Milton Keynes does have some information on the ethnic makeup of the population from the school census data, which is a good source to pick up new ethnic groups moving to Milton Keynes. However this is the first reliable source of data about the whole population since the 1991 census. As Milton Keynes is one of the fastest growing areas in the country, it is particularly important. So I will first talk about what this new data tells us about ethnicity in Milton Keynes as a whole. This will include both the ethnic makeup of the Borough, and some important data which are only available at Borough level. This includes data on the age profile of different ethnic groups, and data on levels of qualification by ethnic group. We also have information about the levels of economic activity by ethnic group. I�ll then move on to describe the dispersal of various ethnic groups within the Borough.
4. 1991 � 2001 Trends This chart is to give an indication of the changes that have taken place in the Borough between 1991 and 2001 in terms of ethnic groups. The proportion of people identifying with minority ethnic groups rose from 5.8% in 1991 to 9.3% in 2001. This figure is broadly in line with England as a whole. This chart illustrates that the growth in minority ethnic groups was not evenly spread. The highest growth has been in the percentage of Black Africans. Asian groups are the largest minority ethnic group with a total of 7,571 people, forming 3.7% of the population. Over 50% of the Asian group is Indian, forming 1.9% of the total MK population. The growth in the Asian population has been spread between Indian, Pakistani, Bangladeshi, Chinese and Other groups. There is also a new classification for the 2001 census, of �Mixed� ethnic group. 1.8% of the population of Milton Keynes identify themselves as mixed, but as this is a new classification, we don�t know if this has altered substantially over time. It may, however, account for some of the changes in levels of the other groups.This chart is to give an indication of the changes that have taken place in the Borough between 1991 and 2001 in terms of ethnic groups. The proportion of people identifying with minority ethnic groups rose from 5.8% in 1991 to 9.3% in 2001. This figure is broadly in line with England as a whole. This chart illustrates that the growth in minority ethnic groups was not evenly spread. The highest growth has been in the percentage of Black Africans. Asian groups are the largest minority ethnic group with a total of 7,571 people, forming 3.7% of the population. Over 50% of the Asian group is Indian, forming 1.9% of the total MK population. The growth in the Asian population has been spread between Indian, Pakistani, Bangladeshi, Chinese and Other groups. There is also a new classification for the 2001 census, of �Mixed� ethnic group. 1.8% of the population of Milton Keynes identify themselves as mixed, but as this is a new classification, we don�t know if this has altered substantially over time. It may, however, account for some of the changes in levels of the other groups.
5. Ethnicity and Qualifications The census results showed that there were major differences in the level of qualifications held amongst the different ethnic groups in Milton Keynes. This chart shows the different levels of those who had low qualifications, defined as no qualifications to 4 GCSEs and High levels of qualification, which included HNC to degree-level qualifications and professional qualifications such as nursing qualifications.
Overall for MK, a slightly lower proportion of 16 to 74 year olds had low qualifications than was average for England & Wales (43.9% compared to 45.6% in E&W), but a lower proportion had high qualifications (17.3% compared to 18.2% in E&W), with a greater proportion having intermediate qualification levels. Broken down by ethnic group Indian persons had a much lower proportion with low qualifications: 29.1% compared to the 43.9% average for MK, and a higher proportion with high qualifications. A very high proportion of Bangladeshis had low levels of qualifications.The census results showed that there were major differences in the level of qualifications held amongst the different ethnic groups in Milton Keynes. This chart shows the different levels of those who had low qualifications, defined as no qualifications to 4 GCSEs and High levels of qualification, which included HNC to degree-level qualifications and professional qualifications such as nursing qualifications.
Overall for MK, a slightly lower proportion of 16 to 74 year olds had low qualifications than was average for England & Wales (43.9% compared to 45.6% in E&W), but a lower proportion had high qualifications (17.3% compared to 18.2% in E&W), with a greater proportion having intermediate qualification levels. Broken down by ethnic group Indian persons had a much lower proportion with low qualifications: 29.1% compared to the 43.9% average for MK, and a higher proportion with high qualifications. A very high proportion of Bangladeshis had low levels of qualifications.
6. Economic Activity & Ethnicity