Download
1 / 23
230 likes | 521 Vues
Chromatin Immunoprecipitation DNA Sequencing (ChIP-seq). Roche 454 (2nd) Illumina Solexa(2nd) ABI SoLid (2nd) Helicos (3rd). Applications De novo sequencing Targeted resequencing Digital Gene Expression (DGE) RNA-seq ChIP-seq. 2nd and 3rd Generation DNA Sequencers and Applications.

E N D
Roche 454 (2nd) Illumina Solexa(2nd) ABI SoLid (2nd) Helicos (3rd) Applications De novo sequencing Targeted resequencing Digital Gene Expression (DGE) RNA-seq ChIP-seq 2nd and 3rd Generation DNA Sequencers and Applications Sequencing Platforms
Why ChIP-seq? • Protein-DNA interactions • Chromatin States • Transciptional regulation
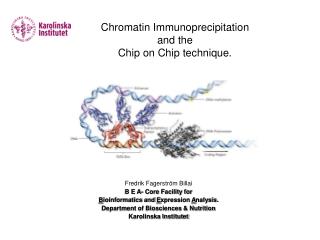
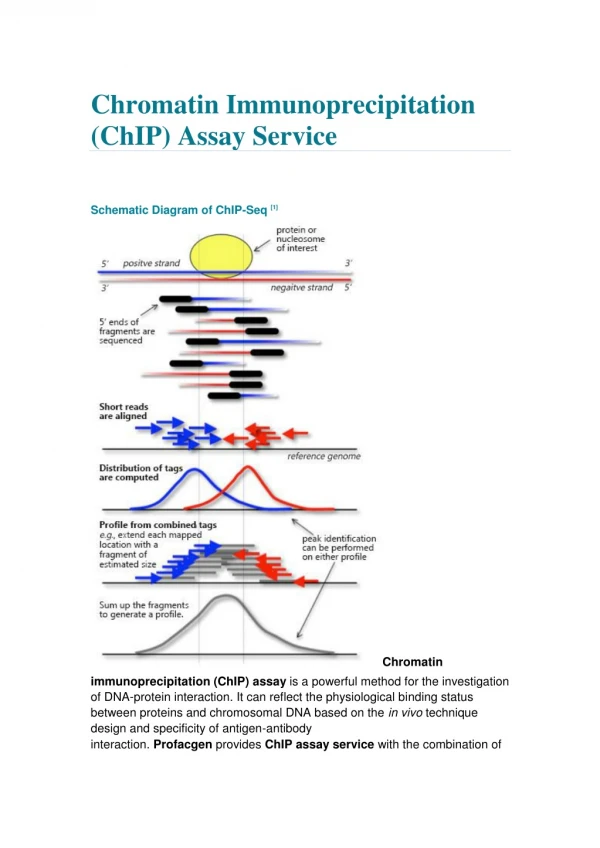
In Nutshell • Protein cross-linked to DNA in vivo by treating cells with formaldehyde • Shear chromatin (sonication) • IP with specific antibody • Reverse cross-links, purify DNA • PCR amplification* • Identify sequences • Genome-wide association map ChIP experiment *-unless using a single molecule sequencer
History: From ChIP-chip to ChIP-seq • ChIP-chip (c.2000) • Resolution (30-100bp) • Coverage limited by sequences on the array • Cross-hybridization between probes and non-specific targets creates background noise
ChIP-seq Materialsample preps with in-house protocols Helicos sample prep Normal QC and ChIP steps Input material 3ng-9ng RNAseA/ProteinaseK treatment (2-3h) Purification (phenol/precipitation) (1.5h) Tailing (1.5h) Termination (1.5h) Amount of library sequenced approx. 1/3 Unique Tags after analysis approx >12M (based on our limited ERaChIP-seq libraries) **Slide borrowed from Thomas Westerling Solexa sample prep Normal QC and ChIP steps Input material typically >30ng End-Repair (1h) Purification (phenol/precipitation) (1.5h) A-overhang (1h) Purification (phenol/precipitation) (1.5h) Adapter oligo ligation (30min) Purification (phenol/precipitation) (1.5h) Size-selection (30min by E-gel) Precipitation (1h) Amplification PCR (2h) (12-18 cycles) Size-selection (30min by E-gel) Precipitation (1h) Diagnostic gel (30min) QC by direct qPCR (4hours) Amount of library sequenced approx. 1/10 Unique Tags after analysis > 3M (based on our limited ERaChIP-seq libraries)
Helicos vs Solexa vs ChIP2 Solexa data (red): Unique tags 4M Peaks called 10 500A Negative peaks 20 000B 2900 1. Solexa 2541 433 Helicos data (blue): Unique tags 13M Peaks called 12 500 Negative peaks 1000E 4700 2. Helicos 3. ChIP2 5293 3744 ChIP2C data (green): Array technology, no tags Peaks called 12 500 FDR 20D 1661 A) More inclusive (10%) ELAND mapping used (compare to Bowtie in library table) B) MACS performs a sample swap between ChIP and Input (chromatin) samples and calculates a local λ-value to determine level of background peaks called in control data. This gives a FDR for each positive peak. Due to the nature of deep sequencing combined with PCR this parameter is in some sample extremely high and not entirely trustworthy. C) ChIP2 data published in Carroll et al. Nat Genet. 2006 Nov;38(11):1289-97. D) FDR values of ChIP2 are calculated differently from FDRs by MACS and are not directly comparable. E) Negative peaks and thus local FDR values are at first glance more reliable in Helicos sequencing, in part at least due to the lack of amplification the removes scientist introduced artifacts and reduced complexity of sequenced library.
ChIP-seq peaks • Only 5’ end of fragments are sequenced • Tags from both + and - strand aligned to reference genome
Types of Analysis Binding site identification and discovery of binding sequence motifs (Non-histone ChIP) Epigenomic gene regulation and chromatin structure (Histone ChIP)
Control: Input DNAMeasuring enrichment Input DNA: portion of DNA sample removed before IP Rozowsky, J. et al. PeakSeq enables systematic scoring of ChIPSeq experiments relative to controls. Nature Biotech. 27, 66-75 (2009)
Why we need to sequence Input DNA • Input DNA does not demostrate “flat” or random (Poisson) distribution • Open chromatin regions tend to be fragmented more easily during shearing • Amplification bias • Mapping artifacts-increased coverage of more “mappable” regions (which also tend to be promotor regions) and repetitive regions due inaccuracies in number of copies in assembled genome
ERa E2 Helicos MACS peaks 12500(tag30 mfold30) – sequence depth determination by subsampling % peaks detected of total peaks/bin % of tags sampled FoldChange Bins 0-20 20-40 40-60 60-80 80-100 100-120 120-140 140-160 160-180 180-200 200-220 Number of total 7687 2841 935 429 217 140 85 49 23 7 4 Peaks in each bin
MACS shifted tag-count graph –i.e. Peak shapes Helicos Input HelicosChIP SolexaChIP Solexa Input
MACS shifted tag-count graph –i.e. Peak shapes Helicos Input HelicosChIP SolexaChIP Solexa Input
MACS shifted tag-count graph –i.e. Peak shapes Helicos Input HelicosChIP SolexaChIP Solexa Input