Download
1 / 24
240 likes | 594 Vues
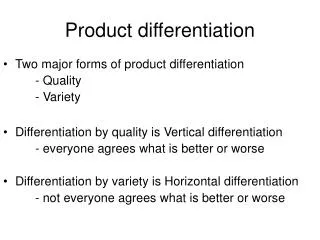
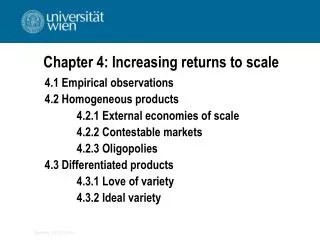
Internal increasing returns to scale, product differentiation, and pattern of trade. Ekonomika in politika mednarodne menjave Jože P. Damijan. Contents. further readings; introduction; assumptions; preference structure; basic model of production; effects of trade; empirics.

E N D
Internal increasing returns to scale, product differentiation, and patternof trade Ekonomika in politika mednarodne menjave Jože P. Damijan
Contents • further readings; • introduction; • assumptions; • preference structure; • basic model of production; • effects of trade; • empirics.
Further readings • Krugman Paul: Increasing returns, monopolistic competition, and international trade. JIE, 1979. • Krugman Paul: Scale Economies, Product Differentiation and the Pattern of Trade. AER, 1980. • Bowen, et.al.: Applied International Trade Analysis, 1998, 364-380. • Borkakoti J.: International trade: Causes and consequences, 1998, 377-401.
Introduction • Empirical evidence 1960s trade; • Linder hypothesis (1961) Intra-industry trade is more intense among countries with similar preferences • Grubel-Lloyd (1975)- Intra-Industry trade • Scale economies, product differentiation, imperfect competition • No factor-proportion differences between countries: • Both countries export differentiated products (direction of trade is not determined); • Trade between two countries is intra-industry trade (trade volume depends on country sizes).
Linder hypothesis (1961) Intra-industry trade is more intense among countries with similar preferences (levels of income) • Necessary condition for exports: existence of domestic demand for certain goods • Required condition for trade: similarity of preferences
Krugman model (1979) Assumptions • 1 factor of production (labor), 1 product, 2 countries; • monopolistic competition, internal economies of scale; • product differentiation (number of firms equals the number of varieties); • a large number of identical consumers (symmetric demand of all available varieties of all products)-preference for variety (more varieties lead to greater utility); • both technology and preferences are identical across countries. Countries differ only in their size. • only IIT is possible between the two countries.
Preferences • Spence-Dixit-Stiglitz utility function; identical consumers and consume all varieties symmetrically (in equalquantities). The common utility function for all consumers is: v' >0, v''<0 • consuming more varieties is preferred to consuming less: 0 < < 1 • parameter of substitution • elasticity of substitution
Basic model of production • Labor is the only factor of production. All goods are produced with the same cost function: • Fixed costs are assumed and constant marginal costs (βw). Average costs decline at all levels of output (at a diminishing rate) wli/xi . • Output of each good must equal the sum of individual consumptions. If we can identify individuals with workers, output must equal consumption of a representative individual times the labor force:
If we assume full employment, so that the total labor force must just be exhausted by labor used in production: • Firms maximize profits, but free entry and exit ensure that profits will be zero. • Large number of firms means that no one firm can ignore its effects on other firms’ behavior, eliminating the indeterminacies of oligopoly. • An individual maximizing his utility subject to the budget constraint. FOC’s have the form: Since all individuals are alike the above equation can be rearranged to form the demand curve facing the single firms producing that good.
Provided a large number of goods are produced, the pricing decision of any one firm will have a negligible effect on the marginal utility of income. In this case each firm faces a demand curve with an elasticity 1/(1-θ) and the profit-maximizing price therefore is: Since β, θ and w are the same for all firms, prices are the same for all goods (p=pi) Profits of the firm producing good i are Since profits are zero the representative firm’s output (which is equal for all firms) equals:
Finally, the number of goods produced can be determined using the full employment condition.
Effects of trade • Supposing the two countries can trade with each other at zero transportation costs. If the countries have the same tastes and technologies, given that there is only one factor of production (there is no difference in endowments). • Trade occurs solely because the world economy produces a greater diversity of goods than each country alone could, therefore offering each individual a wider range of choice. • World economy equilibrium: • Individuals maximizing utility will now distribute their expenditure over both the n goods produced in the home country and the n* goods in the foreign country. • Despite the fact that the real wage remains unchanged the welfare will increase.
Individuals in the home country spend n/n+n* of their income on foreign varieties and the rest on their home varieties. • The value of home country imports measured in wage units is: • The volume of trade is determinate, the direction of trade (which country produces which good) is not. • Trade has no effect on the scale of production and the gains from trade come from increased product diversity.
Empirics Loertscher-Wolter (1980) Intra-industry is intense: • ifthe levels of development of trading countries are high; • among countries with similar levels of development; • if the average of their market sizes is large; • if the difference between their market sizes is small • if trade barriers are low; • in industries with large potential for product differentiation and with barriers to market entry; • due to aggregation issues (comprehensively defined industries have larger IIT shares)
Balassa-Bauwensove preverbe (1986, 1987, 1988) • testira vmesen Linderjev sklep, da bo z gospodarskim razvojem države vedno večji delež trgovine prevzemala IIT • obravnava 38 držav z podatki o trgovinskih tokovih za leto 1971 • oblika modela: • Mij = f (BDP pc, BDP, razdalja, trg.orientacija, dummy spr.) • ugotovi pozitivno korelacijo med deležem znotrajpanožne menjave in BDP pc ter BDP - parc. reg koef sta statistično značilno različna od nič pri 1% stopnji tveganja
Helpman (1987) • Test of assumption that IIT trade between two countries increases in similarity of factor proportions • Proxy for factor proportions: differences in GDP pc • Period 1956-81, annual cross section data • The model: IITij= f (dif GDP pc, max GDP, min GDP) Signs of reg. coefs. do correspond to theoretically expected, however become low and insignificant in more recent years
Hummels-Levinsohn (1995) Redoing Helpman test • Test also for differences in factor proportions • Panel data analysisfor 1962-1983 • The model: IITij= f (dif GDP pw, max GDP, min GDP, dummy vars.) Panel analysis does not confirm the model (problems with switching signs)
Correlation btw. rank IIT and rank of coeffs. for GDPdifOECD,RE model
Correlation btw. rank IIT and rank of coeffs. for GDPdifNon-OECD,RE model