Download
1 / 27
270 likes | 413 Vues
NHS Infrastructure Maturity Model Benchmarking Event Taunton 8th October 2008. Andy Savvides. http://nww.connectingforhealth.nhs.uk/pspg/. Sound Familiar?. Not enough time to plan ahead, too many projects!.

E N D
NHS Infrastructure Maturity ModelBenchmarking Event Taunton 8th October 2008 Andy Savvides http://nww.connectingforhealth.nhs.uk/pspg/
Sound Familiar? Not enough time to plan ahead, too many projects! No infrastructure roadmap so we just react to demands on our IT infrastructure as best we can How do I compare with other Trusts? What IT Infrastructure initiatives should I invest in next? Has somebody else done this before? We are locked in to old software that we cannot upgrade
Infrastructure Challenges Summary • Too many IM&T Managers rely on just gut feel when setting investment priorities • Infrastructure is mostly “invisible” which makes it difficult to understand its value as an enabler • Hard to justify and prioritise investment • Difficult to measure return on investment • Often not viewed in a strategic context • We are undervaluing our own intellectual property • Lack of visibility and focus - NHS is not getting the full value of some excellent local infrastructure work • Nationally we don’t share knowledge, patterns and practices which means we re-invent the wheel and the NHS pays twice • Lack of strategy aligned infrastructure roadmaps means that many essential capabilities loose out to “my favourite project” • Some suppliers don’t create infrastructure solutions that NHS Trusts request, actually need or are ready for
NHS Infrastructure - a day in the life Greater expectations of what IT can deliver Increasing need for accountability Increasing demands to manage TCO & show ROI Regulatory and accreditation demands Constant Change Greater choice & awareness means the business demands a better service IT Infrastructure Standards & Best Practice Emerging Technology Legacy Systems & Components Tacit Knowledge Methodologies & Frameworks Product Guidance from Vendors GPG from NHS CFH IT vendors triggering change IG Toolkit CUI Guidance Enterprise Wide Agreements Constant Pressure to Deliver Local Projects (Many re-inventing the wheel) Growing IT security attack surface Increasing IT complexity Increasing need for business & process alignment
Create a Path to Increased Maturity Greater expectations of what IT can deliver Increasing need for accountability Increasing demands to manage TCO & show ROI Behaviour Regulatory and accreditation demands Culture Attitudes Constant Change (often triggered by IT instead of business need) Greater choice & awareness means the business demands a better service IT Infrastructure Standards & Best Practice Emerging Technology (disruptive) Legacy Systems & Components Tacit Knowledge Methodologies & Frameworks Product Guidance from Vendors GPG from NHS CFH IT vendors triggering change Enterprise Wide Agreements IG Toolkit CUI Guidance Constant Pressure to Deliver Local Projects (Many re-inventing the wheel) Growing IT security attack surface Increasing IT complexity Increasing need for business & process alignment
NIMM Key Features • Intuitive and easy to use IT management tool • Developed in “plain English” by the NHS for the NHS • Modular allowing Trusts to focus on high priority areas first • Will be adapted and extended to reflect feedback changing priorities • Can be used in either Descriptive and/or Prescriptive modes • Provides the big picture - knowledge driven self assessment approach, calibrated for the NHS • Technology & vendor independent, focus is on capabilities, standards and NHS needs • Holistic approach covering both the technology and management scope of IT infrastructure • Being linked to other complementary initiatives • Can be shared with suppliers to help NHS Trusts become smart(er) buyers
Infrastructure Numbers Game 850,000 Estimated Number of PCs in the NHS Hint:
NIMM “Scope” for Guidance Management “Scope” of Infrastructure Technology “Scope” of Infrastructure
NIMM Benchmarking using KPIs Credible, measurable & relevant metrics to measure achievement What factors are critical for a specific capability to be successfully exploited? What do you have to get right? Capability body of knowledge
Infrastructure Maturity Level Summary Not Drawn to Scale
NIMM to Microsoft IO Model Mapping 1 2 3 5 4 Basic Standardized Rationalized Dynamic Identity & Access Management Directory services, User provisioning, Directory-based authentication Desktop, Server, and Device Management Software distribution, Patch management, Mobility, Imaging, Virtualization Security and Networking Policy, Anti-malware, Firewall, Access control, Network protection, Quarantine Data Protection and Recovery Backup, Restore, Storage management IT and Security Process Best practice guidance on cost-effective solution design, development, operation, and support
NIMM to Gartner Model Mapping Business agility Service-level delivery Flexibility, reduce costs Economies of scale Reduce complexity React Objective Months to weeks Weeks to days Weeks to minutes Minutes to seconds Ability to Change Weeks Minutes Variable business costs Fixed shared costs Reduced, fixed costs Variable usage costs Pricing Scheme None, ad hoc Fixed costs Class-of-service SLAs Class-of-service SLAs End-to-end SLAs Business SLAs Business Interface No SLAs Flexible SLAs Policy-based sharing Service-based pools Resource Utilization Unknown Known Rationalized Shared pools Pooled ownership Service-oriented Business-oriented None Central control Consolidated Organization Chaotic – Reactive Ad hoc Reactive -Proactive Life cycle management Proactive Mature problem mgmt Proactive Prediction, dynamic capacity Service End-to-end service management Value Policy management IT Management Processes 5 4 3 Policy/Value-Based Service-Based 1 Virtualized Dynamic optimization to meet SLAs Services managed holistically Rationalized Infrastructure resources pooled Standardized Consolidate to fewer Basic Standard resources, configurations Uncoordinated infrastructure
Infrastructure Numbers Game 19 Number high severity vulnerabilities in Windows XP discovered during 2007 according to National Vulnerability Database (NIST) Hint:
Typical Start Point for Many Trusts 1 Basic 2 Controlled 3 Standardised 4 Optimised 5 Innovative
Focus on “Weakest” Capabilities 1 Basic 2 Controlled 3 Standardised 4 Optimised 5 Innovative
Drive Standardisation 1 Basic 2 Controlled 3 Standardised 4 Optimised 5 Innovative
Optimise & Innovate 1 Basic 2 Controlled 3 Standardised 4 Optimised 5 Innovative
NIMM Prescriptive Guidance “Package” Description of the capability at level n. This will include the critical success factors which describe what characteristics the capability must have and why they are important. A set of metrics that can be used to measure and monitor achieving this capability at level n. What will it take (financial and non-financial) to achieve this level of capability. To be used in creating a business case. What benefit can realistically be expected (financial and non-financial) when operating at this level of capability. To be used in determining the to-be profile. Major impact/effect on other upstream or downstream capabilities when this capability reaches level n. Weighting used when calculating overall Class or Trust maturity level
Infrastructure Numbers Game 6 No of Electronic Identities a typical NHS Worker has Hint:
NIMM Applications Financial Management Maturity
Infrastructure TCO Challenge £150 £2000
Mythical Gartner TCO Benchmark Some government departments and the wider public sector have paid at least £2,000 per PC, partly because this is regarded as the standard price for fully supported, networked PCs. John Suffolk told Gartner, "I think we have fundamentally failed …. to understand the cost of what we do. And I roundly blame Gartner for this, because you guys are the ones who come up with TCO [total cost of ownership] benchmarking. It has become a self-fulfilling prophecy. "So, I go out and I pick boring desktop infrastructure. What price do you think the suppliers broadly pitch? You will not be shocked to know that it is somewhere around the Gartner TCO benchmark." Suffolk said a business will be told that the price of a desktop is value for money because it is the same or a little below Gartner's benchmark.
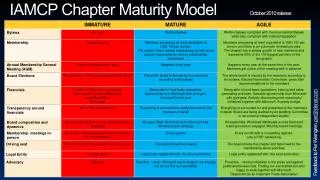
Value Management Framework Level 1 Basic Level 2 Controlled Level 3 Standardised Level 4 Optimised Level 5 Innovative “Little visibility of true costs” “Controls in place, some consistency” “Consistency enables TCO benchmarking” “ROI Enabled” “Portfolio driving the business agenda” Little or no visibility of costs Costs visible Standardised cost control Costs and benefitsvisible Dashboard performance review Ad-hoc Chart of Accounts Locally Consistent chart of accounts Nationally Consistent chart of accounts Consideration of risk and time value of money Portfolio risk return perspective Gut feel and subjective measures Appropriate categorisation of spend Follows Best Practice Detailed business case based on ROI IT influencing business agenda Non repeatable processes Some consistency inProcess RepeatableProcess Performance and value benchmarking External industry benchmarking
TCO Model • In order to drive standardisation the NIMM TCO Model supports Level 3 Financial Management and provides: • Common Chart of Accounts • Takes into account Organisational Complexity • Adjusts results for Confidence based upon NIMM maturity
Feedback? Questions? Ideas? andy.savvides@nhs.net http://nww.connectingforhealth.nhs.uk/pspg/