Download
1 / 33
330 likes | 454 Vues
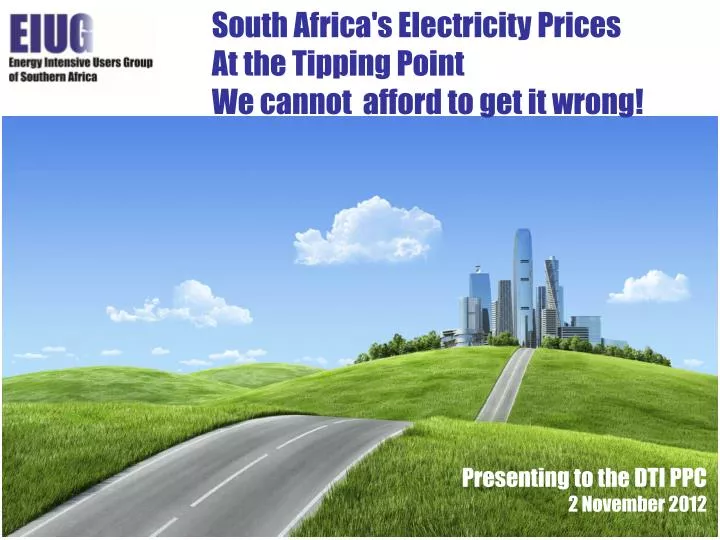
South Africa's Electricity Prices At the Tipping Point We cannot afford to get it wrong!. Presenting to the DTI PPC 2 November 2012. AGENDA. Primary Sector leads Job & Economic Growth MYPD3 Prices will Slash Growth and Jobs Industrial, Commercial and Domestic Sectors Impacted The Solution

E N D
South Africa's Electricity PricesAt the Tipping Point We cannot afford to get it wrong! Presenting to the DTI PPC 2 November 2012
AGENDA • Primary Sector leads Job & Economic Growth • MYPD3 Prices will Slash Growth and Jobs • Industrial, Commercial and Domestic Sectors Impacted • The Solution • Conclusion
Value Chain Marketing & Sales Producing Products for Retail Exploration Mining Concentrating Smelting/ Extraction Metal Refining Producing Products for Manufacturing The delicate balance in transformation!Job retention/creation in primary, secondary and tertiary sectors New Job Creation SA cannot leapfrog the value nodes without a surplus of skilled labour! China, India, Russia etc are progressively taking jobs from South Africa by importing South African ore in raw form and investing in these higher value adding steps! South Africa then has to import the value add good from China. South Africa is selling its birthrights! Plus Tertiary Value Chain Jobs Plus Secondary Value Chain Jobs Primary Value Chain Jobs
Interrupted! South Africa’s Economic Transformation Source: GAPMINDER
Growth driven by credit fuelled Non-tradable Sectors Tradable export sectors have languished….. Low Job Creating Non-tradable sectors High Job Creating Tradable sectors
Non-tradable sector – Sucking-in imports and creating external imbalances, such as running large current account deficits…..
AGENDA • We are at a Tipping Point • Primary Sector to lead Job & Economic Growth • MYPD3 Prices will Slash Growth and Jobs • Industrial, Commercial and Domestic Sectors Impacted • The Solution • Conclusion
Losing the BalanceMust be Tough on Costs, Subsidies & Sales…Soft on Prices Rising Too Fast & High! Price Dictating Industrial Policy? Too High! Costs & Subsidies = Unaffordable Sales Too Low!
Electricity Prices are Making South Africa Non Competitive 130 Rc/kWh (by 2022) Worst Case Efficiency Price Path EIUG Modelling Eskom's MYPD3 Application Eskom's MYPD3 Application (Scenario 1) Best Case Efficiency Price Path IRP 2010 Future Economy? MYPD3 Sources: IRP2010, Eskom, Frost & Sullivan, EIUG
The Tipping Point for RSA Residential Residential Commercial Mining & Industrial Commercial Industrial Source: Eskom and The U.S. Energy Information Administration (EIA)
Threat to the Future of Steel Production in South Africa 2022 South Africa MYPD3 Scenario 1 Source: EIUG Steel Industry Data
Threat to the Future of FeCr Smelting in South Africa MYPD 3 US mills per kWh Source: CRU for comparison up to 2011, SA escalations going forward shown in real 2011 terms with CPI of 5% assumed
SA Ferrochrome market share is being displaced to China Flight of South African Industry! World Chrome Ore resources by region Breakdown of market share for FeCr production
Notwithstanding that South Africa is the World leader in ferrochrome manufacturing technology—almost 100% locally-sourced • Furnace type • (Open vs Closed) • Furnace size • (MVA) • Power consumption • (MWh/t) • Closed • South Africa • 3.68 • South Africa • South Africa • 43 • 3.73 • 38 • 3.78 • Kazakhstan • 33 • 3.83 • 28 • Semi-closed • 3.88 • Kazakhstan • 3.93 • 23 • Kazakhstan • India • 3.98 • 18 • India • India • 4.03 • 13 • 4.08 • China • China • China • Open • 8
SA Mining and Industry being Priced out of Jobs Cost of doing business in SA has grown at an alarming rate CAGR 11.1% SA FeCr industry cost growth CAGR 8.4% Source: CRU, Xstrata Analysis, Company annual reports
Serious Impact from Electricity Price increases Sample of 13 Large South African Industrial Companies 2017 2012 Source: Genesis Analytics
Mining Alone – An Essential Core Of SA Economy • Creates 1.3 million jobs (500 000 direct & 800 000 indirect). • Accounts for about 19% of GDP (9% direct, 10% indirect & induced). • Critical earner of foreign exchange >50%. • Accounts for 20% of investment (12% direct). • Attracts significant foreign savings (R1.4 trillion/ 29% of value of JSE). • 17.7% of corporate tax receipts, 2011 R26bn & R5.5 billion in royalties. • R437 billion in expenditures, +/- R389 billion spent locally. • R89 billion spent in wages and salaries • 50% of volume of Transnet’s rail and ports • 94% of electricity generation via coal power plants • 15% of electricity demand • About 37% of country’s of liquid fuels via coal • R4 billion spent on skills development • R1.4 billion spent on community investment
AGENDA • We are at a Tipping Point • Primary Sector to lead Job & Economic Growth • MYPD3 Prices will Slash Growth and Jobs • Commercial and Domestic Sectors also Impacted • Recommendations • Conclusion
Household electricity prices on PPP basis using the Big Mac Index – 2009 to 2012 RSA 2012 RSA 2009 www.Economists.co.za
AGENDA • We are at a Tipping Point • Primary Sector to lead Job & Economic Growth • MYPD3 Prices will Slash Growth and Jobs • Industrial, Commercial and Domestic Sectors Impacted • The Solution • Conclusion
Recommendations • Cut Inefficient Costs • Improve ESKOM Operating Efficiencies • Improve ESKOM Capital Cost Efficiencies • Accelerate IPP’s • Remove Non-Electrical Subsidies • Improve Consumption Efficiencies • Increase Electricity Sales • Reduce Excessive Safety Margins if Funding Allowances
Eskom’s Operating Efficiencies Low! • A Universal Fact: • Unplanned Work is > 50% more expensive than planned work IPP’s and Competition will Ensure Efficiencies Return
Eskom’s Building Efficiencies Low Eskom 95 c/kWh IPP’s < 75 c/kWh Source: Black & Veatch
Inefficiency in Current Domestic Demand Reducing Increasing
Eskom Revenue is GuaranteedPrices Soar if Energy Sales are Low or Fall Revenue Requirement = Return & Depreciation Prudent expenditure + + Other • Levies • Taxes • Claw-back Revenue Price Forecast Energy Sales = % Return on Assets (ROA) Cost of Sales x + Primary Energy Imports IPP Purchases Asset Base O&M Revalued Assets WUC + + Staff Maintenance • Reduce Prices by • Increasing Sales Overhead Costs Asset Depreciation
Reduce Excessive Safety Margins in Funding Source: Frost & Sullivan Price (10% ROA) Justifiable Price Price (4% ROA) d:e (4% ROA) Justifiable d:e d:e (10% ROA)
Subsidies are Killing Jobs By 2017/18 >24% of the Industrial Tariff is Subsidy Contribution By 2017/18 It could be >30% Excluding Municipal Subsidies Added
On Top of this Municipalities are Loading the variable (energy) charges Sources: BDO, select municipalities The true reflection of what is actually being charged is however often understated due to non-standard charges. NERSA regulates categories consisting of an energy charge, a demand charge and a fixed charge. Surcharges and levies fall outside the mandate of NERSA and Nersa is thus not in a position to regulate additional levies or surcharges that municipalities impose. Municipalities appear to be able to apply such non-standard charges at their discretion with little or no regulation.
And on Top of this Municipalities are also Loading the fixed (Demand) charges Sources: BDO, select municipalities A recent BDO analysis of the purchase costs from both Eskom and the municipalities making up the study found that there is a heavy bias in the costs for the demand charge component of electricity. The tariffs bear the imprint of historical investment decisions at the point of their inception. The question must be asked why such inflated charges are still being charged against equipment that should be fully depreciated.
AGENDA • We are at a Tipping Point • Primary Sector to lead Job & Economic Growth • MYPD3 Prices will Slash Growth and Jobs • Industrial, Commercial and Domestic Sectors Impacted • The Solution • Conclusion
ConclusionTough on Costs, Subsidies & SalesSoft on Prices Cut Inefficient Costs – Do Not Simply Increase Prices Refine funding Model – Regulatory Methodology needs to be reassessed Remove Excessive Funding Safety Margins Increase Sales – This reduces Prices We do not need Subsidies – Just Remove the non Cost Reflective charges