Download
1 / 47
470 likes | 651 Vues
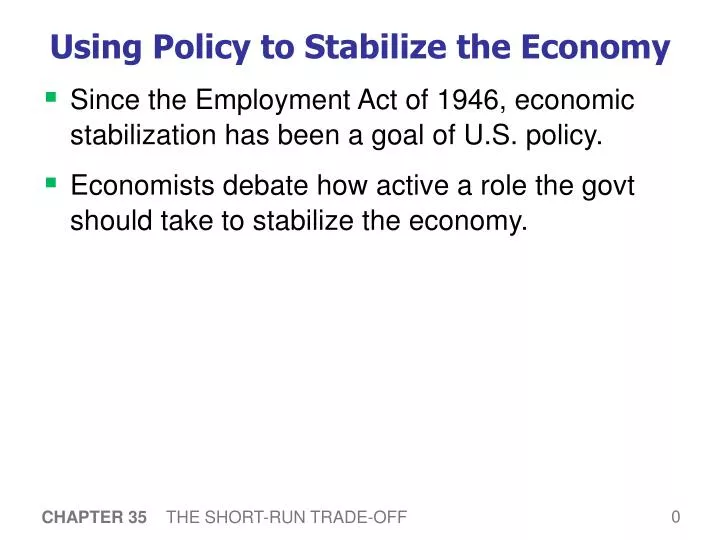
Using Policy to Stabilize the Economy. 0. Since the Employment Act of 1946, economic stabilization has been a goal of U.S. policy. Economists debate how active a role the govt should take to stabilize the economy. The Case for Active Stabilization Policy. 0.

E N D
Using Policy to Stabilize the Economy 0 • Since the Employment Act of 1946, economic stabilization has been a goal of U.S. policy. • Economists debate how active a role the govt should take to stabilize the economy. CHAPTER 35 THE SHORT-RUN TRADE-OFF
The Case for Active Stabilization Policy 0 • Keynes: “animal spirits” cause waves of pessimism and optimism among households and firms, leading to shifts in aggregate demand and fluctuations in output and employment. • Also, other factors cause fluctuations, e.g., • booms and recessions abroad • stock market booms and crashes • If policymakers do nothing, these fluctuations are destabilizing to businesses, workers, consumers. CHAPTER 35 THE SHORT-RUN TRADE-OFF
The Case for Active Stabilization Policy 0 • Proponents of active stabilization policy believe the govt should use policy to reduce these fluctuations: • when GDP falls below its natural rate, should use expansionary monetary or fiscal policy to prevent or reduce a recession • when GDP rises above its natural rate, should use contractionary policy to prevent or reduce an inflationary boom CHAPTER 35 THE SHORT-RUN TRADE-OFF
Keynesians in the White House 0 1961: John F Kennedy pushed for a tax cut to stimulate agg demand. Several of his economic advisors were followers of Keynes. 2001: George W Bush pushed for a tax cut that helped the economy recover from a recession that had just begun. CHAPTER 35 THE SHORT-RUN TRADE-OFF
The Case Against Active Stabilization Policy 0 • Monetary policy affects economy with a long lag: • firms make investment plans in advance, so I takes time to respond to changes in r • most economists believe it takes at least 6 months for mon policy to affect output and employment • Fiscal policy also works with a long lag: • Changes in G and T require Acts of Congress. • The legislative process can take months or years. CHAPTER 35 THE SHORT-RUN TRADE-OFF
The Case Against Active Stabilization Policy 0 • Due to these long lags, critics of active policy argue that such policies may destabilize the economy rather than help it: By the time the policies affect agg demand, the economy’s condition may have changed. • These critics contend that policymakers should focus on long-run goals, like economic growth and low inflation. CHAPTER 35 THE SHORT-RUN TRADE-OFF
Automatic Stabilizers 0 • Automatic stabilizers: changes in fiscal policy that stimulate agg demand when economy goes into recession, without policymakers having to take any deliberate action CHAPTER 35 THE SHORT-RUN TRADE-OFF
Automatic Stabilizers: Examples 0 • The tax system • Taxes are tied to economic activity. When economy goes into recession, taxes fall automatically. • This stimulates agg demand and reduces the magnitude of fluctuations. CHAPTER 35 THE SHORT-RUN TRADE-OFF
Automatic Stabilizers: Examples 0 • Govt spending • In a recession, incomes fall and unemployment rises. • More people apply for public assistance (e.g., unemployment insurance, welfare). • Govt outlays on these programs automatically increase, which stimulates agg demand and reduces the magnitude of fluctuations. CHAPTER 35 THE SHORT-RUN TRADE-OFF
CONCLUSION 0 • Policymakers need to consider all the effects of their actions. For example, • When Congress cuts taxes, it needs to consider the short-run effects on agg demand and employment, and the long-run effects on saving and growth. • When the Fed reduces the rate of money growth, it must take into account not only the long-run effects on inflation, but the short-run effects on output and employment. CHAPTER 35 THE SHORT-RUN TRADE-OFF
CHAPTER SUMMARY 0 • In the theory of liquidity preference, the interest rate adjusts to balance the demand for money with the supply of money. • The interest-rate effect helps explain why the aggregate-demand curve slopes downward: An increase in the price level raises money demand, which raises the interest rate, which reduces investment, which reduces the aggregate quantity of goods & services demanded. CHAPTER 35 THE SHORT-RUN TRADE-OFF
CHAPTER SUMMARY 0 • An increase in the money supply causes the interest rate to fall, which stimulates investment and shifts the aggregate demand curve rightward. • Expansionary fiscal policy – a spending increase or tax cut – shifts aggregate demand to the right. Contractionary fiscal policy shifts aggregate demand to the left. CHAPTER 35 THE SHORT-RUN TRADE-OFF
CHAPTER SUMMARY 0 • When the government alters spending or taxes, the resulting shift in aggregate demand can be larger or smaller than the fiscal change: The multiplier effect tends to amplify the effects of fiscal policy on aggregate demand. The crowding-out effect tends to dampen the effects of fiscal policy on aggregate demand. CHAPTER 35 THE SHORT-RUN TRADE-OFF
CHAPTER SUMMARY 0 • Economists disagree about how actively policymakers should try to stabilize the economy. Some argue that the government should use fiscal and monetary policy to combat destabilizing fluctuations in output and employment. Others argue that policy will end up destabilizing the economy, because policies work with long lags. CHAPTER 35 THE SHORT-RUN TRADE-OFF
In this chapter, look for the answers to these questions: • How are inflation and unemployment related in the short run? In the long run? • What factors alter this relationship? • What is the short-run cost of reducing inflation? • Why were U.S. inflation and unemployment both so low in the 1990s? CHAPTER 35 THE SHORT-RUN TRADE-OFF
P R I N C I P L E S O F FOURTH EDITION The Short-Run Trade-off Between Inflation and Unemployment 35
Introduction • In the long run, inflation & unemployment are unrelated: • The inflation rate depends mainly on growth in the money supply. • Unemployment (the “natural rate”) depends on the minimum wage, the market power of unions, efficiency wages, and the process of job search. • In the short run, society faces a trade-off between inflation and unemployment. CHAPTER 35 THE SHORT-RUN TRADE-OFF
The Phillips Curve • Phillips curve: shows the short-run trade-off between inflation and unemployment • 1958: A.W. Phillips showed that nominal wage growth was negatively correlated with unemployment in the U.K. • 1960: Paul Samuelson & Robert Solow found a negative correlation between U.S. inflation & unemployment, named it “the Phillips Curve.” CHAPTER 35 THE SHORT-RUN TRADE-OFF
Deriving the Phillips Curve • Suppose P = 100 this year. • The following graphs show two possible outcomes for next year: A. Agg demand low, small increase in P (i.e., low inflation), low output, high unemployment. B. Agg demand high, big increase in P (i.e., high inflation), high output, low unemployment. CHAPTER 35 THE SHORT-RUN TRADE-OFF
P inflation SRAS B B 5% 105 A A 103 AD2 3% PC AD1 Y 6% u-rate 4% Y2 Y1 Deriving the Phillips Curve A. Low agg demand, low inflation, high u-rate B. High agg demand, high inflation, low u-rate CHAPTER 35 THE SHORT-RUN TRADE-OFF
The Phillips Curve: A Policy Menu? • Since fiscal and mon policy affect agg demand, the PC appeared to offer policymakers a menu of choices: • low unemployment with high inflation • low inflation with high unemployment • anything in between • 1960s: U.S. data supported the Phillips curve. Many believed the PC was stable and reliable. CHAPTER 35 THE SHORT-RUN TRADE-OFF
Evidence for the Phillips Curve? During the 1960s, U.S. policymakers opted for reducing unemployment at the expense of higher inflation CHAPTER 35 THE SHORT-RUN TRADE-OFF
The Vertical Long-Run Phillips Curve • 1968: Milton Friedman and Edmund Phelps argued that the tradeoff was temporary. • Natural-rate hypothesis: the claim that unemployment eventually returns to its normal or “natural” rate, regardless of the inflation rate • Based on the classical dichotomy and the vertical LRAS curve. CHAPTER 35 THE SHORT-RUN TRADE-OFF
P inflation LRAS LRPC P2 P1 AD2 low infla-tion high infla-tion AD1 Y u-rate natural rate of output natural rate of unemployment The Vertical Long-Run Phillips Curve In the long run, faster money growth only causes faster inflation. CHAPTER 35 THE SHORT-RUN TRADE-OFF
Reconciling Theory and Evidence • Evidence (from ’60s): PC slopes downward. • Theory (Friedman and Phelps’ work):PC is vertical in the long run. • To bridge the gap between theory and evidence, Friedman and Phelps introduced a new variable: expected inflation – a measure of how much people expect the price level to change. CHAPTER 35 THE SHORT-RUN TRADE-OFF
Natural rate of unemp. Unemp. rate Actual inflation Expected inflation a – – = The Phillips Curve Equation Short run Fed can reduce u-rate below the natural u-rate by making inflation greater than expected. Long runExpectations catch up to reality, u-rate goes back to natural u-rate whether inflation is high or low. CHAPTER 35 THE SHORT-RUN TRADE-OFF
inflation LRPC 5% 3% PC2 PC1 u-rate 6% 4% How Expected Inflation Shifts the PC Initially, expected & actual inflation = 3%,unemployment = natural rate (6%). Fed makes inflation 2% higher than expected, u-rate falls to 4%. In the long run, expected inflation increases to 5%, PC shifts upward, unemployment returns to its natural rate. B C A CHAPTER 35 THE SHORT-RUN TRADE-OFF
ACTIVE LEARNING 1: Exercise Natural rate of unemployment = 5%Expected inflation = 2%Coefficient a in PC equation = 0.5 A. Plot the long-run Phillips curve. B. Find the u-rate for each of these values of actual inflation: 0%, 6%. Sketch the short-run PC. C. Suppose expected inflation rises to 4%. Repeat part B. D. Instead, suppose the natural rate falls to 4%. Draw the new long-run Phillips curve, then repeat part B. 27
LRPCD PCB LRPCA PCD PCC ACTIVE LEARNING 1: Answers An increase in expected inflation shifts PC to the right. A fall in the natural rate shifts both curves to the left. 28
The Breakdown of the Phillips Curve Early 1970s: unemployment increased, despite higher inflation. Friedman & Phelps’ explanation: expectations were catching up with reality. CHAPTER 35 THE SHORT-RUN TRADE-OFF
Another PC Shifter: Supply Shocks • Supply shock: an event that directly alters firms’ costs and prices, shifting the AS and PC curves • Example: large increase in oil prices CHAPTER 35 THE SHORT-RUN TRADE-OFF
P inflation SRAS2 SRAS1 B B P2 A A P1 PC2 AD PC1 Y u-rate Y1 Y2 How an Adverse Supply Shock Shifts the PC SRAS shifts left, prices rise, output & employment fall. Inflation & u-rate both increase as the PC shifts upward. CHAPTER 35 THE SHORT-RUN TRADE-OFF
Oil price per barrel 1/1973 $ 3.56 1/1974 10.11 1/1979 14.85 1/1980 32.50 1/1981 38.00 The 1970s Oil Price Shocks The Fed chose to accommodate the first shock in 1973 with faster money growth. Result: Higher expected inflation, which further shifted PC. 1979: Oil prices surged again, worsening the Fed’s tradeoff. CHAPTER 35 THE SHORT-RUN TRADE-OFF
The 1970s Oil Price Shocks Supply shocks & rising expected inflation worsened the PC tradeoff. CHAPTER 35 THE SHORT-RUN TRADE-OFF
The Cost of Reducing Inflation • Disinflation: a reduction in the inflation rate • To reduce inflation, Fed must slow the rate of money growth, which reduces agg demand. • Short run: output falls and unemployment rises. • Long run: output & unemployment return to their natural rates. CHAPTER 35 THE SHORT-RUN TRADE-OFF
inflation LRPC A B C PC1 PC2 u-rate natural rate of unemployment Disinflationary Monetary Policy Contractionary monetary policy moves economy from A to B. Over time, expected inflation falls, PC shifts downward. In the long run, point C: the natural rate of unemployment, and lower inflation. CHAPTER 35 THE SHORT-RUN TRADE-OFF
The Cost of Reducing Inflation • Disinflation requires enduring a period of high unemployment and low output. • Sacrifice ratio: the number of percentage points of annual output lost in the process of reducing inflation by 1 percentage point • Typical estimate of the sacrifice ratio: 5 • Reducing inflation rate 1% requires a sacrifice of 5% of a year’s output. • This cost can be spread over time. Example: To reduce inflation by 6%, can either • sacrifice 30% of GDP for one year • sacrifice 10% of GDP for three years CHAPTER 35 THE SHORT-RUN TRADE-OFF
Rational Expectations, Costless Disinflation? • Rational expectations: a theory according to which people optimally use all the information they have, including info about govt policies, when forecasting the future • Early proponents: Robert Lucas, Thomas Sargent, Robert Barro • Implied that disinflation could be much less costly… CHAPTER 35 THE SHORT-RUN TRADE-OFF
Rational Expectations, Costless Disinflation? • Suppose the Fed convinces everyone it is committed to reducing inflation. • Then, expected inflation falls, the short-run PC shifts downward. • Result: Disinflations can cause less unemployment than the traditional sacrifice ratio predicts. CHAPTER 35 THE SHORT-RUN TRADE-OFF
The Volcker Disinflation Fed Chairman Paul Volcker • appointed in late 1979 under high inflation & unemployment • changed Fed policy to disinflation 1981-1984: • Fiscal policy was expansionary, so Fed policy needed to be very contractionary to reduce inflation. • Success: Inflation fell from 10% to 4%,but at the cost of high unemployment… CHAPTER 35 THE SHORT-RUN TRADE-OFF
The Volcker Disinflation Disinflation turned out to be very costly: u-rate near 10% in 1982-83 CHAPTER 35 THE SHORT-RUN TRADE-OFF
The Greenspan Era: 1987-2006 Inflation and unemployment were low during most of Alan Greenspan’s years as Fed Chairman. CHAPTER 35 THE SHORT-RUN TRADE-OFF
1990s: The End of the Phillips Curve? • During the 1990s, inflation fell to about 1%, unemployment fell to about 4%.Many felt PC theory was no longer relevant. • Many economists believed the Phillips curve was still relevant; it was merely shifting down: • Expected inflation fell due to the policies of Volcker and Greenspan. • Three favorable supply shocks occurred. CHAPTER 35 THE SHORT-RUN TRADE-OFF
Favorable Supply Shocks in the ’90s • Declining commodity prices (including oil) • Labor-market changes (reduced the natural rate of unemployment) • Technological advance (the information technology boom of 1995-2000) CHAPTER 35 THE SHORT-RUN TRADE-OFF
CONCLUSION • The theories in this chapter come from some of the greatest economists of the 20th century. • They teach us that inflation and unemployment • are unrelated in the long run • are negatively related in the short run • are affected by expectations, which play an important role in the economy’s adjustment from the short-run to the long run. CHAPTER 35 THE SHORT-RUN TRADE-OFF
CHAPTER SUMMARY • The Phillips curve describes the short-run tradeoff between inflation and unemployment. • In the long run, there is no tradeoff: Inflation is determined by money growth, while unemployment equals its natural rate. • Supply shocks and changes in expected inflation shift the short-run Phillips curve, making the tradeoff more or less favorable. CHAPTER 35 THE SHORT-RUN TRADE-OFF
CHAPTER SUMMARY • The Fed can reduce inflation by contracting the money supply, which moves the economy along its short-run Phillips curve and raises unemployment. In the long run, though, expectations adjust and unemployment returns to its natural rate. • Some economists argue that a credible commitment to reducing inflation can lower the costs of disinflation by inducing a rapid adjustment of expectations. CHAPTER 35 THE SHORT-RUN TRADE-OFF