Download
1 / 1
10 likes | 95 Vues
A 4.0 mg ml -1 sample of PA was examined with a Philips FEI XL30 SEM electron microscope. The samples were prepared by freezing, fracturing, subliming water and coating with Pt/Pd.

E N D
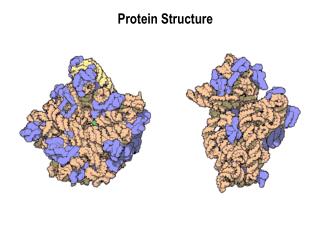
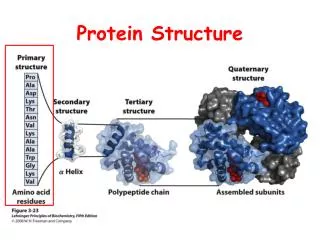
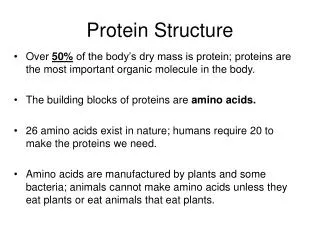
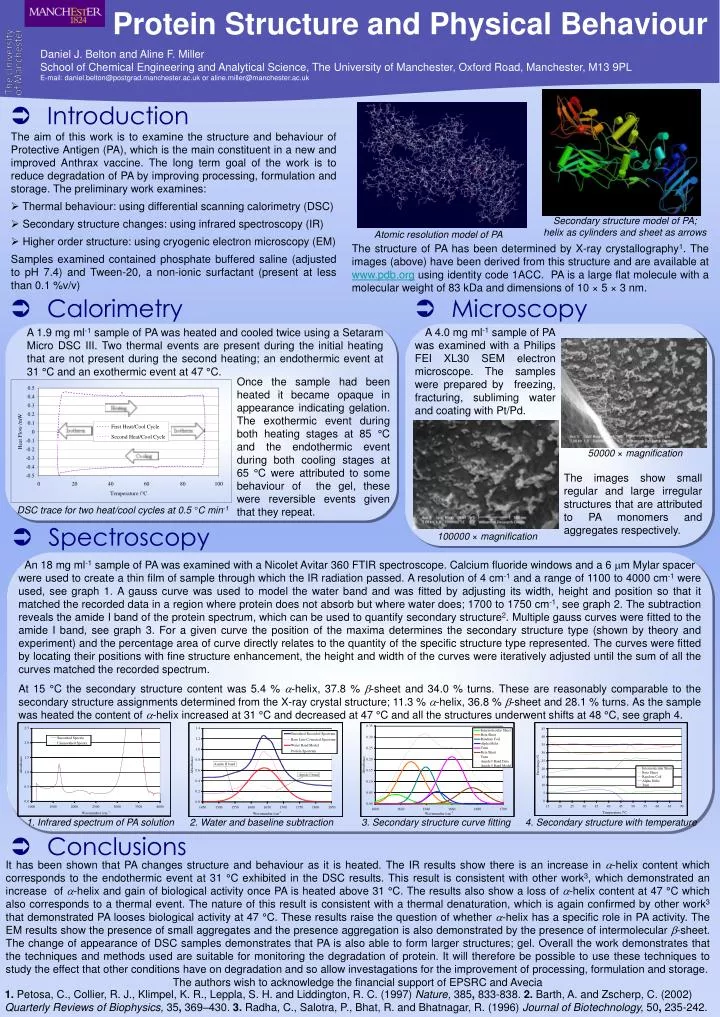
A 4.0 mg ml-1 sample of PA was examined with a Philips FEI XL30 SEM electron microscope. The samples were prepared by freezing, fracturing, subliming water and coating with Pt/Pd. A 1.9 mg ml-1 sample of PA was heated and cooled twice using a Setaram Micro DSC III. Two thermal events are present during the initial heating that are not present during the second heating; an endothermic event at 31 °C and an exothermic event at 47 °C. Once the sample had been heated it became opaque in appearance indicating gelation. The exothermic event during both heating stages at 85 °C and the endothermic event during both cooling stages at 65 °C were attributed to some behaviour of the gel, these were reversible events given that they repeat. 50000 × magnification The images show small regular and large irregular structures that are attributed to PA monomers and aggregates respectively. DSC trace for two heat/cool cycles at 0.5 °C min-1 100000 × magnification 1. Infrared spectrum of PA solution 2. Water and baseline subtraction 3. Secondary structure curve fitting 4. Secondary structure with temperature Protein Structure and Physical Behaviour Daniel J. Belton and Aline F. MillerSchool of Chemical Engineering and Analytical Science, The University of Manchester, Oxford Road, Manchester, M13 9PLE-mail: daniel.belton@postgrad.manchester.ac.uk or aline.miller@manchester.ac.uk • The aim of this work is to examine the structure and behaviour of Protective Antigen (PA), which is the main constituent in a new and improved Anthrax vaccine. The long term goal of the work is to reduce degradation of PA by improving processing, formulation and storage. The preliminary work examines: • Thermal behaviour: using differential scanning calorimetry (DSC) • Secondary structure changes: using infrared spectroscopy (IR) • Higher order structure: using cryogenic electron microscopy (EM) Samples examined contained phosphate buffered saline (adjusted to pH 7.4) and Tween-20, a non-ionic surfactant (present at less than 0.1 %v/v) Secondary structure model of PA; helix as cylinders and sheet as arrows Atomic resolution model of PA • Introduction The structure of PA has been determined by X-ray crystallography1. The images (above) have been derived from this structure and are available at www.pdb.org using identity code 1ACC. PA is a large flat molecule with a molecular weight of 83 kDa and dimensions of 10 × 5 × 3 nm. • Calorimetry • Microscopy • Spectroscopy An 18 mg ml-1 sample of PA was examined with a Nicolet Avitar 360 FTIR spectroscope. Calcium fluoride windows and a 6 m Mylar spacer were used to create a thin film of sample through which the IR radiation passed. A resolution of 4 cm-1 and a range of 1100 to 4000 cm-1 were used, see graph 1. A gauss curve was used to model the water band and was fitted by adjusting its width, height and position so that it matched the recorded data in a region where protein does not absorb but where water does; 1700 to 1750 cm-1, see graph 2. The subtraction reveals the amide I band of the protein spectrum, which can be used to quantify secondary structure2. Multiple gauss curves were fitted to the amide I band, see graph 3. For a given curve the position of the maxima determines the secondary structure type (shown by theory and experiment) and the percentage area of curve directly relates to the quantity of the specific structure type represented. The curves were fitted by locating their positions with fine structure enhancement, the height and width of the curves were iteratively adjusted until the sum of all the curves matched the recorded spectrum. At 15 °C the secondary structure content was 5.4 % a-helix, 37.8 % b-sheet and 34.0 % turns. These are reasonably comparable to the secondary structure assignments determined from the X-ray crystal structure; 11.3 % a-helix, 36.8 % b-sheet and 28.1 % turns. As the sample was heated the content of a-helix increased at 31 °C and decreased at 47 °C and all the structures underwent shifts at 48 °C, see graph 4. • Conclusions It has been shown that PA changes structure and behaviour as it is heated. The IR results show there is an increase in a-helix content which corresponds to the endothermic event at 31 °C exhibited in the DSC results. This result is consistent with other work3, which demonstrated an increase of a-helix and gain of biological activity once PA is heated above 31 °C. The results also show a loss of a-helix content at 47 °C which also corresponds to a thermal event. The nature of this result is consistent with a thermal denaturation, which is again confirmed by other work3 that demonstrated PA looses biological activity at 47 °C. These results raise the question of whether a-helix has a specific role in PA activity. The EM results show the presence of small aggregates and the presence aggregation is also demonstrated by the presence of intermolecular b-sheet. The change of appearance of DSC samples demonstrates that PA is also able to form larger structures; gel. Overall the work demonstrates that the techniques and methods used are suitable for monitoring the degradation of protein. It will therefore be possible to use these techniques to study the effect that other conditions have on degradation and so allow investagations for the improvement of processing, formulation and storage. The authors wish to acknowledge the financial support of EPSRC and Avecia 1. Petosa, C., Collier, R. J., Klimpel, K. R., Leppla, S. H. and Liddington, R. C. (1997) Nature, 385, 833-838. 2. Barth, A. and Zscherp, C. (2002) Quarterly Reviews of Biophysics, 35, 369–430. 3. Radha, C., Salotra, P., Bhat, R. and Bhatnagar, R. (1996) Journal of Biotechnology, 50, 235-242.