Download
1 / 14
140 likes | 228 Vues
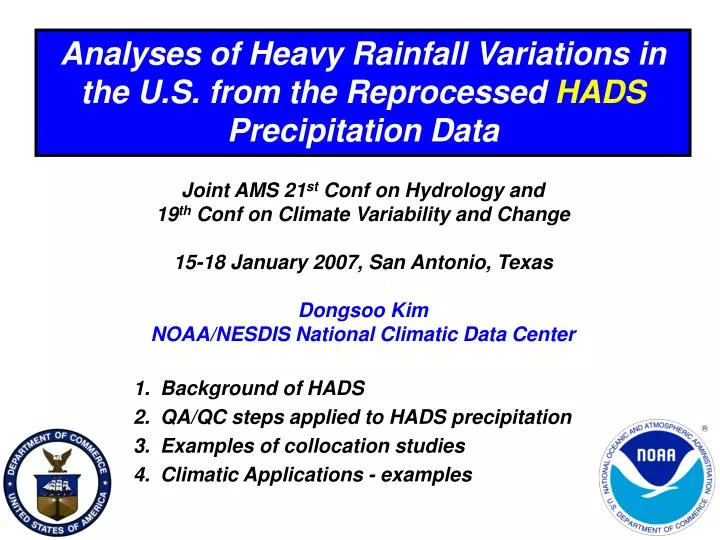
Analyses of Heavy Rainfall Variations in the U.S. from the Reprocessed HADS Precipitation Data. Joint AMS 21 st Conf on Hydrology and 19 th Conf on Climate Variability and Change 15-18 January 2007, San Antonio, Texas Dongsoo Kim NOAA/NESDIS National Climatic Data Center.

E N D
Analyses of Heavy Rainfall Variations in the U.S. from the Reprocessed HADS Precipitation Data Joint AMS 21st Conf on Hydrology and 19th Conf on Climate Variability and Change 15-18 January 2007, San Antonio, Texas Dongsoo Kim NOAA/NESDIS National Climatic Data Center • Background of HADS • QA/QC steps applied to HADS precipitation • Examples of collocation studies • Climatic Applications - examples
Focus on Hourly Precipitation Data • ASOS operated by FAA at the airport.~ 1K • Hourly COOP by Citizens. Data are collected and QC’ed at NCDC (Dataset number 3240). ~2K • Mesonet operated by states (e.g., OK mesonet) ~1K • HADS (Hydrometeorological Automated Data System) ~6K • USGS gauges • RAWS (Remote Area Weather Stations) • US Army Corp of Engineers • and whoever participate Data Collection Platform
HADS Processing Suite NWS/OHD DCP Original SHEF HADS PC, Derived PP USGS Gauges RAWS Some NWS/RFC USACE Others Some NWS/WFO NWS/NCEP Edited ASOS Original PP UCAR NESDIS/NCDC Real-time flow Archival flow
Handling of gross errors Gross and negative precipitation Displaying in PC rather than PP helps identifying nature of problems. (Left) The processing to PP will cause big jump as -30 and then +30 in 15 min period. (Right) The PP will show recurring pair of -0.01 and +0.01 in 15 min period. All time-series plots are taken from http://www.nws.noaa.gov/oh/hads/
Result of Reprocessing – An example Two time-series of hourly PP. The UCAR- archive (top) shows 40 missing values (reddots), while NCDC reprocessing (bottom) recovered all of them. Eight out of 40 were rain events. By not accounting missing values, monthly total of UCAR-archive is 7.86 inches, while NCDC-reprocessed is 9.89 inches, i.e., gain of 25% in monthly total in the reprocessing. The UCAR-archive, i.e., CPC processing was suffered by real-time constraint. Can we improve it? Who? The heavy precip (1.23 in/hour) occurred on 0700 UTC, Sep 28, 2004. The 15min PC show intensive rainfalls on 0630 UTC; ARRN7 2004 928 545 0 PC RGZ 19.560 Z -1.00 0 0 ARRN7 2004 928 6 0 0 PC RGZ 19.630 Z -1.00 0 0 ARRN7 2004 928 615 0 PC RGZ 19.780 Z -1.00 0 0 ARRN7 2004 928 630 0 PC RGZ 20.490 Z -1.00 0 0 ARRN7 2004 928 645 0 PC RGZ 20.810 Z -1.00 0 0 ARRN7 2004 928 7 0 0 PC RGZ 20.860 Z -1.00 0 0 ARRN7 2004 928 715 0 PC RGZ 20.930 Z -1.00 0 0 Bias correction based on UCAR-archive PP surely pose problem. Comparison of two hourly products derived from the same shef-encoded HADS data
Development of Collocation Table Collocation Table will serve user-defined spatial consistency criteria. The neighboring stations are within 0.5 deg radius and closest 20 stations from the target HADS station. … HPNN7 12 36.14 -79.86 HPNN7 313630 314063 317202 317097 312631 312238 310286 314675 311239 317548 313919 313555 1 0 0 0 0 0 0 0 0 0 31 0 0 2.36 2.09 3.90 4.54 3.88 6.20 2.72 3.92 4.83 6.20 0.00 8.09 7.87 36.14 36.08 35.95 36.38 35.82 36.52 36.42 35.70 36.32 36.08 36.23 36.10 36.07 -79.86 -79.95 -80.00 -79.70 -79.82 -79.75 -80.20 -79.78 -80.27 -79.42 -80.30 -79.40 -79.40 … Line 1: HADS name, Number of buddy stations, and lat/lon Line 2: HADS station name, 12 COOP stations Line 3: Number of missing values Line 4: Monthly total rainfall excluding missing values, if any Line 5: Station latitudes Line 6: Station longitude
Derivative of Collocation Table Obs(LST): COOP observation time in Local Standard Time MD(in): Mean differences of daily precip in inch (COOP minus HADS) RMSD(in): Root-mean-squared-differences of daily precip in inch Ratio: Ratio of monthly totals (COOP / HADS) Dist(deg): Distance of COOP station from HADS station in degree
Collocation of HADS with NEXRAD - an example Accumulated precipitation amounts from 3 independent observing systems during August, 2004. Both HADS stations HPNN7 and SBPN7 are near Greensboro, NC owned by USGS. They are southeast of the hourly COOP station 313630 at almost the same distance, ~10km. Blue dotted lines are NEXRAD DPA estimate at the nearest grid of respected HADS stations.
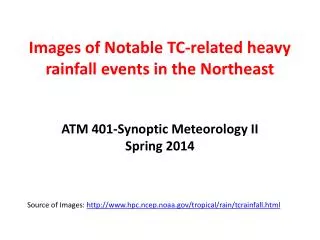
Climatic Applications - Heavy Rainfall along Hurricane tracks • Sub-set of CONUS HADS stations within +/- 3 deg, and +/- 9 hours along six-hourly Hurricane tracks. • Any station with missing values during the 18 hrs period is not counted. • Hurricanes of 2004: Charley, Ivan, Florence and Jeanne. • Heavy rainfall criteria: >= 1 inch/hour • >= 5 inches/18hours.
Climatic Applications – Regional Diurnal Variations • Samples of Coastal Region ~ 600 HADS stations currently • Removed stations of more than 48 hours of missing values
Midnight in LST Midnight in LST Midnight in LST Midnight in LST
Summary • Reprocessed HADS hourly precipitation will be additional hydro-climate data for many regional applications such as • Sub-daily storm total of precipitation • Diurnal precipitation variability • Input to hydrologic modeling • Flash flood climatology • QPF verifications etc • QC/QA is ongoing effort • Request data (Version 1.0) satorder@ncdc.noaa.gov or Dongsoo.Kim@noaa.gov