Download
1 / 77
1.05k likes | 1.68k Vues
The Microbiome and Metagenomics. Catherine Lozupone CPBS 7711 September 19, 2013. What is the microbiome ?. “The ecological community of commensal, symbiotic, and pathogenic microorganisms that share our body space”

E N D
The Microbiome and Metagenomics Catherine Lozupone CPBS 7711 September 19, 2013
What is the microbiome? • “The ecological community of commensal, symbiotic, and pathogenic microorganisms that share our body space” • Microbiota: “collection of organisms” Microbiome: “collection of genes” • Bacteria, Archaea, microbial eukaryotes (e.g. fungi or protists) and viruses. • Body Sites • Important roles in health and disease: Gut, Mouth, Vagina, Skin (diverse sites:Nasal epithelial) • Important roles in disease: Lung, blood, liver, urine
The big tree • Majority of life’s diversity is microbial • Majority of microbial life cannot be grown in pure culture Pace, N.R.,The Universal Nature of Biochemistry. PNAS Vol 98(3) pp 805-808.
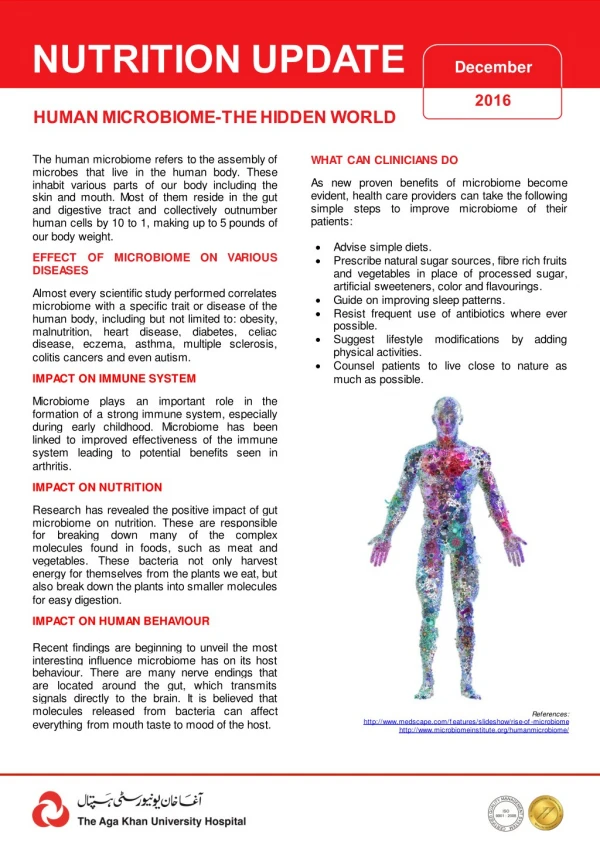
The Human Gut Microbiota • 100 trillion microbial cells: outnumber human cells 10 to 1! • Most gut microbes are harmless or beneficial. • Protect against enteropathogens • Extract dietary calories and vitamins • Prevent immune disorders • List of diseases associated with dysbiosis ever growing • Inflammatory Diseases: IBD, IBS • Metabolic Diseases: Obesity, Malnutrition • Neurological Disorders • Cancer
What do we want to understand? • What does a healthy microbiome look like? • How diverse is it? • What types of bacteria are there? • What is their function? • How variable is the microbiome? • Over time within an individual? • Across individuals? • Functionally? • What are driving factors of variability? • Age, culture, physiological state (pregnancy) • How do changes affect disease? • What properties (taxa, amount of diversity) change with disease? • Cause or affect? • Functional consequences of dysbiosis • Host Interactions • Evolution/adaptation to the host over time. • Immune system
Culture-independent studies revolutionized our understanding of gut bacteria • Culture-based studies over-emphasized the importance of easily culturable organisms (e.g. E. coli). Culture-independent surveys 2.PCR amplify SSU rRNAgene (which species?) Sequence random fragments (which function?) Extract DNA from environmental samples. 3. Evaluate Sequences
Gut microbiota has simple composition at the phylum level Different phyla: Animals and plants Data from: Yatsunenkoet. al. 2012. Nature.
Diversity of Firmicutes in 2 healthy adults • Each person harbors > 1000 species. • Some species are unique (red and blue) • Some shared (purple) • We know very little about what most of these species do!
Sequencing technology renaissance enabled more complex study designs • Sanger Sequencing (thousands) • Pyrosequencing (millions) • Illumina (billions!)
Metagenomics • The study of metagenomes, genetic material recovered directly from environmental samples. • Marker gene • PCR amplify a gene of interest • Tells you what types of organisms are there • Bacteria/Archaea (16S rRNA), Microbial Euks (18S rRNA), Fungi (ITS), Virus (no good marker) • Shotgun • Fragment DNA and sequence randomly. • Tells you what kind of functions are there.
Small Subunit Ribosomal RNA • Present in all known life forms • Highly conserved • Resistant to horizontal transfer events 16S rRNA secondary structure
Other ‘Omics • MetaTranscriptomics (sequence version of microarray) • Isolate all RNA • Deplete rRNA • Sequence all transcripts • Sometimes phenotype only seen in activity of the microbiota • Metabolomics • What metabolites does a community produce? • E.g. in feces or urine • MetaProteomics • What proteins does a community produce?
Integrating Data Types • 16S rRNA -> shotgun metagenomics • What gene differences cannot be explained by 16S? • Selection by HGT • 16S/ genomics -> transcriptomics-> metabolomics • What species or genes (or combination of species or genes), when expressed, are responsible for producing a given metabolite?
Sequencing Technologies • Sanger -> 454 Pyrosequencing -> Illumina
Short reads (pyrosequencing) can recapture the result. • UW UniFrac clustering with Arb parsimony insertion of 100 bp reads extending from primer R357. • Assignment of short reads to an existing phylogeny (e.g. greengenes coreset) allows for the analysis of very large datasets. Liu Z, Lozupone C, Hamady M, Bushman FD & Knight R (2007) Short pyrosequencing reads suffice for accurate microbial community analysis. Nucleic Acids Res 35: e120.
Preprocessing pyrosequencing datasets • Quality filtering: Discard sequences that: • Are too short and too long (200-1000 range) • With low quality scores • With long homopolymers • Can trim poor quality regions from the ends • PyroNoise and Chimeras • Can greatly inflate OTU counts • Pyronoise algorithm uses SFF files to fix noisy sequences • Use barcodes to assign sequences to samples
Defining species: OTU picking • Cluster sequences based on % identity • 97% id typical for species • CD-HIT, UCLUST • For Phylogenetic diversity measures need to make a tree • Align sequences: NAST, PyNAST • Denovo tree building: FastTree • Assign reads to sequences in a pre-defined reference tree
Comparing Diversity • Overview of methods for evaluating/comparing microbial diversity across samples using 16S rRNA • diversity: Measures how much is there? • diversity: How much is shared? • Phylogenetic verses taxon based diversity. • Quantitative verses Qualitative diversity. • What types of taxa are driving the patterns? Which species are associated with measured properties? • Tools: UniFrac/QIIME/Topiary Explorer • Lozupone, C.A. and R. Knight (2008) Species divergence and the measurement of microbial diversity. FEMS Microbiol Rev. 1-22.
How do we describe and compare diversity? • Diversity: • “How many species are in a sample?” • (e.g. 6 colors in A and 6 in B) • e.g.: Are polluted environments less diverse than pristine? • Diversity: • “How many species are shared between samples?” • (e.g. 2 shared colors between A and B) • e.g.: Does the microbiota differ with different disease states? A B
Quantitative versus Qualitative measures A • Qualitative: Considers presence absence only • : How many species are in a sample? • e.g.: 6 colors in both A and B. • How many species are shared between samples? • e.g.: A and B are identical because the same colors are present in both. • Quantitative:Also considers relative abundance. • : Accounts for “evenness”: • e.g. B, where the population is evenly distributed across the 6 species, is more diverse than A, where all species are present but red dominates. • Samples will be considered more similar if the same species are numerically dominant versus rare. • e.g. B and A no longer look identical because of differences in abundance. B
What is a phylogenetic diversity measure? A • Diversity: • Taxon: “How many species are in a sample?” • Phylogenetic: “How much phylogenetic divergence is in a sample?” • (e.g. B more individually diverse than A - more divergent colors) • Diversity: • Taxon: “How many species are shared between samples?” • Phylogenetic: “How much phylogenetic distance is shared between samples?” • (only related colors from B are in A) B
Advantages of phylogenetic techniques. • Phylogenetically related organisms are more likely to have similar roles in a community. • Taxon-based methods assume a “star phylogeny,” where all relationships between taxa are ignored. • Phylogeny and Taxon-based methods can be complementary.
Diversity Measures • Diversity • Phylogenetic Diversity: PD • Taxon-based: • observed # species (richness) • Correct for undersampling (Chao1, Ace) • Richness + evenness (Shannon-Weaver index) • Diversity • Test if samples have significantly different membership. • UniFrac Significance, P test, Libshuff (Phylogenetic) • Identify environmental variables associated with differences between many samples. • Phylogenetic • Unweighted and Weighted UniFrac • DPCoA • Taxon-based: Jaccard/Sorenson indices
Sum of branches leading to sequences in a sample. Sample with taxa spanning the most branch length in this tree represents the most phylogenetically and perhaps functionally divergent community. Phylogenetic Diversity (PD) Faith, D.P. (1992) Conservation evaluation and phylogenetic diversity. Biological Conservation 61, 1-10.
PD Rarefaction • Plot the amount of branch length against the # of observations. • Shape of curve allows for estimating how far we are from sampling all of the phylogenetic diversity. • Allows for comparison of phylogenetic diversity between samples. Eckburg, P.B., et al. (2005) Diversity of the human intestinal microbial flora. Science 308, 1635-1638.
Phylogenetic and OTU based techniques can be complementary • Results of analyzing the same data with Chao1 and PD. • Samples from stool, mouth, lung, plasma, and negative controls. • Differentiation between the stool/mouth and negative controls greater with Chao1 than with PD • The negative controls have few OTUs but they are phylogenetically diverse • Chao1 estimates go up with sampling effort.
Phylogenetic diversity: How is diversity partitioned across samples? • Do two samples contain significantly different microbial populations? • Can we see broad trends that relate many samples and explain them in terms of environmental factors?
Unique Fraction (UniFrac) metric • Qualitative phylogenetic diversity. • Distance = fraction of the total branch length that is unique to any particular environment. Lozupone and Knight, 2005, Appl Environ Microbiol 71:8228
Clustering with the UniFrac Algorithm Can we see broad trends that relate many samples and explain them in terms of environmental factors?
pH 0-100°C 1-12 Pressure Oligotrophic Eutrophic 1-200 atm What types of environments have similar phylogenetic diversity? Temperature Nutrient Availability • Lozupone CA & Knight R (2007) Global patterns in bacterial diversity. Proc Natl Acad Sci U S A104: 11436-11440.
Salinity is the most important factor PCoA of UniFrac Distance Matrix
Hierarchical clustering (UPGMA) of the same UniFrac distance matrix
Qualitative vs Quantitative measures of Phylogenetic Diversity • Qualitative: • Unweighted UniFrac • Detects factors restrictive for microbial growth. • High temperature, low pH, founder effects. • Quantitative: • Weighted UniFrac, DPCoA. • Detects transient changes. • Seasonal changes, nutrient availability, response to pollution. • Yield different, complementary results and applying both to same data can provide insight into nature of community changes.
Weighted UniFrac Qualitative Quantitative Lozupone et al., 2007. Appl Environ Microbiol 73:1576
Mice heterozygous for mutation in Leptin gene interbreed. 16S gene sequenced for bacteria in gut of mothers and offspring. Obesity and Gut Microbiota Ley et al., (2005)Obesity Alters Gut Microbiota, PNAS Vol 102: pp 11070-11075
So how about the obese mice? Mice cluster perfectly by mother Ley et al., (2005)Obesity Alters Gut Microbiota, PNAS Vol 102: pp 11070-11075
Unweighted UniFrac Comparison of human stool and mucosal microbes Eckburg, P.B., et al. (2005) Diversity of the human intestinal microbial flora. Science 308, 1635-1638. • Unweighted: all samples cluster by individual. • Weighted: stool looks different. Weighted UniFrac
Measures in the same class cluster the data similarly • Double principal coordinates analysis (DPCoA) • Another quantitative diversity measure. • A matrix of species distances is first used to ordinate the species using PCoA. • The position of the communities in coordinate space is the average position of the species that they contain, weighted by relative abundances. • Produces same results as weighted UniFrac.
Fast UniFrac • Computation enhancements create order of magnitude increases in speed and reduced memory requirements. Hamady, Lozupone and Knight, The ISME Journal. 2009. Epub ahead of print.
Avoiding bias • Pyrosequencing often produces high variability in the number of sequences per sample. • This can introduce bias because undersampling creates inflated beta diversity values • Randomly resampled a dataset at different depths and calculated the average UniFrac distance. • Samples with fewer sequences look artificially different. • Rarefaction: randomly select an even amount of sequences Lozupone et al. 2011. ISME. 5:169-72
Web interfaces have >2200 registered users. Unifrac papers have collectively 1250 citations. 461 citations
Study effects drive clustering of Western adults Lozupone et al. Genome Research. 2013
Supervised Learning, classical statistics, taxonomic classification, and phylogenetic trees; How can we use these tools to understand which microbial taxa change across treatments?