Download
1 / 45
450 likes | 460 Vues
Πανεπιστήμιο Πατρών Advanced Topics in Finance Week 5/13 Mean-Variance model. Vasilios I. Sogiakas. Advanced Topics in Finance. Contents Recommended reading Return and risk of individual shares Portfolio return and risk Mean-variance model (Markowitz model)

E N D
Πανεπιστήμιο ΠατρώνAdvanced Topics in FinanceWeek 5/13Mean-Variance model Vasilios I. Sogiakas
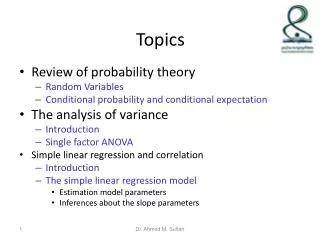
Advanced Topics in Finance Contents • Recommended reading • Return and risk of individual shares • Portfolio return and risk • Mean-variance model (Markowitz model) • The mean-variance approach – the case of two assets • Diversification benefits • The Mean-Variance Approach: The case of n assets (illustration) • Diversification • Idiosyncratic risk • Systematic risk • Risk and uncertainty • Sensitivity analysis • The modern theory of utility • Investor’s behavior • Risk premium • Joint Investments: Portfolio Management
Advanced Topics in Finance Recommended reading • Bodie, Z. Kane, A. and Marcus, A. (2014). Investments. McGraw-Hill.10th, ed. • McMillan, Pinto, Pirie, Gerhard, “Investments: Principles of Portfolio and Equity Analysis”, Chapters 4, 5, 6 • Jones, ‘Investments: Principles and Concepts’: Chapter 7, 8. 9 • Bailey, ‘The Economics of Financial Markets’: Chapter 5, 6, 8, 9, 11 • Levy and Sarnat, ‘Portfolio and Investment Selection: Theory and Practice’: Chapter 7, 8 and10-15 • Bodie, Merton & Cleeton, ‘Financial Economics’: Chapter 13
Advanced Topics in Finance Return and risk of individual shares • The return that is based on historical data, represents the observed return at a specific time interval. However, in most cases we are interested in the expected returns of financial products, ex ante. The expected return, in a simple notation, is defined as the weighted average of all possible future outcomes / states (j) taking into account the corresponding probability distribution. At t the expected return is given by the formula: • where, the probability measure (ptj) is based on many factors, such as the macroeconomic environment, the specific financial ratios of the examined firm and the financial market conditions.
Advanced Topics in Finance Return and risk of individual shares • The quantification of risk is based on the statistical measures of dispersion, such as the standard deviation, the variance, the coefficient of variation and the mean absolute deviation. The variance expresses the weighted sum of squared deviation of the random variable (returns) from their mean, considering the corresponding probability distribution. The standard deviation (σ) has the advantage that is expressed in the same units as the returns, deriving easier the appropriate interpretation of risk: • The coefficient of variation is defined is defined as the ratio of risk and mean return: CV = σ / E(r). When we appraise a single investment we are based on the expected rate of return and on the risk of the project. So investors should quantify the expected return and the associated risk in order to make a decision on the investment. • However, it is a common practice that private or public hedge funds, firms and banks allocate their assets into many different investments (diversification). The total investments of a firm or an individual is called portfolio. Thus, we should be aware of the expected return and the risk that is embedded on portfolios of financial products rather than investigating single assets. Thus it would be very important to understand the consequences of including a share into a portfolio, in terms of the first two moments.
Advanced Topics in Finance Portfolio return and risk The expected rate of return of a portfolio consisting of n assets would be the weighted average of the individual share expected returns: where, ri is the expected return of share i and wi is the portion of the portfolio value invested on asset i. The weights wi should sum to unity. The risk of the portfolio depends on the specific risk of each component of the portfolio and furthermore, depends on the covariance between them: where σij is the covariance of the returns of the i, j shares.
Advanced Topics in Finance Mean-variance model (Markowitz model) • Markowitz and Tobin base their theory of investment choice under conditions of uncertainty on the mean and the variance of the distributions of returns. Markowitz has developed a mean-variance (MV) model for the selection of portfolios, according to which investors desire high returns but are averse to a high variance, which is an indicator of an investment’s risk. The Markowitz-Tobin analysis remains the cornerstone of much of the work in the field of investment analysis. • According to the MV model rational investors would prefer investments with high returns and low risk. It is similar with maximization of the ratio of the mean return over the standard deviation, and represents the return in terms of risk units.
Advanced Topics in Finance Mean-variance model (Markowitz model) • According to the MV approach, the satisfaction (utility) of a risk averter investor would be reduced due to an increment of the risk that his portfolio embeds. Hence, a risk averter investor in order to hold his utility fixed, should be compensated with higher returns whenever his portfolio’s risk is increased. In other words, the risk averter’s utility will change, unless any increment of his portfolio’s risk is compensated with higher portfolio return. Inversely, a risk averter investor would not be unsatisfied if his portfolio’s return is reduced due to a decrement of its risk level. This relationship between risk and return is illustrated through the indifference curves of a risk averter investor: Figure 1 indifference curves – risk averter, risk lover and risk neutral This utility function of a risk averter is convex, since for each increment of the risk level the corresponding extra required return is increasing, implying a positive marginal rate of increments. Every rational investor who is risk averter would prefer the maximum utility function, which is located on the north east area of Figure 6.1.
Advanced Topics in Finance The mean-variance approach – the case of two assets In the case of a portfolio that consists of two assets (shares) with expected returns, r1 and r2, and standard deviation σ1 and σ2, the expected return and the variance of the portfolio, are given by the following equations: Rportfolio = w1 r1 + w2 r2 , where w1 + w2 = 1 Rportfolio= w1 r1 + (1-w1) r2 and σ2portfolio = w12σ12 + w22σ22 + 2 w1w2σ12 σ2portfolio = w12 σ12 + w22 σ22 + 2 w1w2 σ1 σ2 ρ12 The risk of the portfolio depends on: • the individual risk of the shares • the weights of the shares • the covariance of the share returns
Advanced Topics in Finance The mean-variance approach – the case of two assets The covariance is a statistical measure that expresses the interdependence between two random variables. More specifically, the covariance between the returns of two shares represents their relationship and is given below: where pij is the joint probability of the random variables of the returns, while the k, m indicators represent the state or the events of the random variables. Alternatively, the relationship of the two random variables could be expressed through the correlation coefficient (ρij), which is the covariance of the standardized random variables: ρij=σij/σiσj. The correlation coefficient is bounded |ρij|<1 and expresses the degree of linear dependence between the two variables. The diversification benefits for a portfolio consisting of two shares (r1 < r2 & σ1 < σ2) depend on the correlation coefficient of the shares’ returns.
Advanced Topics in Finance The mean-variance approach – the case of two assets Figure 2 Correlation coefficient of share returns (p=-1, 0, 1) ρ12 = 1 (perfect positive linear relationship) no diversification benefits σ2portfolio = w12 σ12 + w22 σ22 + 2 w1 w2 σ1 σ2 σ2portfolio= (w1 σ1 + w2 σ2)2 σportfolio = w1 σ1 + w2 σ2 ρ12 = 0 (uncorrelated variables) some diversification benefits σ2portfolio = w12σ12 + w22σ22 σ2portfolio= (w1σ1+w2σ2)2-2w1w2σ1σ2 ρ12 = -1 (perfect negative linear relationship): maximum diversification benefits σ2portfolio=w12σ12+w22σ22-2w1w2σ1σ2 σ2portfolio= (w1σ1-w2σ2)2 σportfolio = w1σ1 – w2σ2
Advanced Topics in Finance The mean-variance approach – the case of two assets Figure 3 Risk and return of a portfolio of two assets
Advanced Topics in Finance The mean-variance approach – the case of two assets In order to find the portfolio with the minimum variance or standard deviation we should minimize the variance function with respect to the weight w1:
Advanced Topics in Finance Diversification benefits Suppose that an investor considers two shares with the following characteristics, r1 = 5%, σ1 = 3%, r2 = 11%, σ2 = 7% The coefficient of correlation of the returns of the two shares is equal with -0,5. How can the investor maximize his diversification benefits? Figure 4 Maximum diversification benefit
Advanced Topics in Finance The Mean-Variance Approach: The case of n assets (illustration) Suppose that you consider six shares (simulation) with the following characteristics (mean return and risk): Figure 1 Return and Standard deviation of 6 shares Obviously, there is a trend, higher risk to be awarded with higher returns.
Advanced Topics in Finance The Mean-Variance Approach: The case of n assets (illustration) Suppose now, that there exist 15 investors, each of which constructs a portfolio consisting of these shares based on the available informational set and his risk tolerance. The following figure illustrates the portfolio weights for the 15 investors: Figure 2 Simulated portfolios – portfolio weights
Advanced Topics in Finance The Mean-Variance Approach: The case of n assets (illustration) Feasible Portfolio Set • In the following figure the area below the dashed curve represents the set of all feasible risk-return combinations (all possible portfolios) and is called feasible portfolio set (FPS). Investors are based on their expectations and construct portfolios that contribute to the formulation of the required returns that would compensate them for the risk they undertake. In this figure there exist portfolios the returns of which do not account for the high level of risk they embed, sufficiently. Figure 3 Feasible Portfolio Set
Advanced Topics in Finance The Mean-Variance Approach: The case of n assets (illustration) Efficient Portfolio Frontier • Rational investors, who are risk averters, would prefer portfolios the return of which is maximized for a specific level of risk, or would prefer portfolios the risk of which is minimized for a specific target return. Thus, rational investors’ choices are represented by the north - west points of figure 6.3. • In the case of n shares we may construct many portfolios of different size while for each portfolio there exist many other choices regarding the weighting scheme. All possible combinations of a portfolio of size k among n shares (k<n) are equal to: • For example in the case of the 6 shares we could construct many different portfolios with respect to the components of the portfolio: 2 assets: 15 portfolios 3 assets: 20 portfolios 4 assets: 15 portfolios 5 assets: 6 portfolios 6 assets: 1 portfolio
Advanced Topics in Finance The Mean-Variance Approach: The case of n assets (illustration) Efficient Portfolio Frontier • Thus, a reasonable question is whether an investor, should consider all these combinations before constructing his portfolio. The Modern Portfolio Theory answers this problem, since investors should not investigate all possible portfolios, but instead only those portfolios that for a specific level of risk offer the maximum return, or inversely, those portfolios that for a specific target return embed the lower level of risk. The portfolios that follow this property are called efficient portfolios and the combination of all these efficient portfolios, forms the efficient portfolio frontier (EPF). • Thus, rational investors would formulate a new set of portfolios, the Efficient Portfolio Frontier, which is derived by the feasible portfolio set and satisfies the following two principles: - for a specific target portfolio return, embeds the lower level of risk (west) - for a specific level of risk, offers the highest portfolio return (north) • All portfolios that belong to the EPF contain the highest level of the ratio return/risk and consequently represent the optimum choices for investors.
Advanced Topics in Finance The Mean-Variance Approach: The case of n assets (illustration) Efficient Portfolio Frontier Figure 4 Feasible Portfolio Set and the Efficient Portfolio Frontier
Advanced Topics in Finance The Mean-Variance Approach: The case of n assets (illustration) Efficient Portfolio Frontier • In the following figure (Figure 6.5) we observe the EPF and two other choices, points K and K’ • K’ is not a feasible portfolio, while K is not an efficient one, since there exist other portfolios (i.e. M, N) that for the same portfolio return embed lower risk, or for the same level of risk they offer higher returns, respectively • Thus, rational and risk avert investors will never choose a portfolio in the area below the EPF and their decision would potentially maximize their satisfaction Figure 5 Efficient Portfolio Frontier - EPF
Advanced Topics in Finance The Mean-Variance Approach: The case of n assets (illustration) Efficient Portfolio Frontier The Efficient Portfolios of our analysis consist only of equities, i.e. financial products that embed risk. Thus, the slope of the tangency of the EPF curve represents the extra risk that investors are willing to undertake for a marginal increment on their portfolios’ returns. All portfolios on the EPF have the maximum return/risk ratio.
Advanced Topics in Finance The Mean-Variance Approach: The case of n assets (illustration) Optimum Portfolio • The utility function of a risk avert investor expressed on the first two moments is a convex function • Risk avert investors are willing to maximize their utility Figure 6 Risk averter profile (convex function)
Advanced Topics in Finance The Mean-Variance Approach: The case of n assets (illustration) Optimum Portfolio • By consideration of the utility function in the investigation of a portfolio choice, there exist a portfolio on the EPF for which investor’s utility is maximized • This portfolio (A) is called optimum, since it offers the investor the maximum expected utility among all EPF portfolios and is identified at the point at which the slope of the utility function is equal to the slope of the EPF, as shown on Figure 7. Figure 7 Optimum Portfolio
Advanced Topics in Finance The Mean-Variance Approach: The case of n assets (illustration) Optimum Portfolio • However, the utility function is a locus that expresses the individual investor’s expectations and consequently the optimum portfolio should be different among investors • For a more risk averter investor (U1) the optimum portfolio is A while for a less risk averter investor (U2) the optimum portfolio is B, as illustrated below: Figure 8 Optimum portfolios for two risk averter investors (with different risk tolerance) • As we have already seen the concavity of the EPF depends on the correlation structure of the equity returns, inversely, and as a result lower correlation structure (closer to -1) of asset returns would maximize investor’s satisfaction
Advanced Topics in Finance Diversification • The portfolio variance is given by the following equation: • Alternatively, by factorizing the elements of the main diagonal of the var-covariance matrix we get: • Assuming that all shares have the same variance (σ2), that each pair of shares has the same covariance (cov) and that the portfolio is equally-weighted (w=1/n) then we get: • This relationship implies that as the size of the portfolio is increased (n∞) the contribution of individual shares on the portfolio variance, is decreased, since the portfolio variance depends mainly on the covariance between shares’ returns.
Advanced Topics in Finance Diversification Figure 9 Portfolio size and diversification As the number of shares on the portfolio is increased the idiosyncratic risk of each share is omitted (diversified), while the systematic risk is not affected.
Advanced Topics in Finance Diversification Idiosyncratic risk • Idiosyncratic risk is the part of the risk due to the specific characteristics of the corresponding listed firm, such as the management, the technological factors and many other factors and is called idiosyncratic or specific or non systematic risk • When a share is included in the market portfolio, part of the risk is omitted given that the correlation coefficient of the returns of the share and the market portfolio is low • This portion of risk is not of interest when dealing with well diversified portfolios, in the sense that unanticipated losses from one share on the portfolio are offset by profits of another one
Advanced Topics in Finance Diversification Systematic risk • Systematic risk is the part of the risk that is undiversifiable because it is associated with many factors that are common for all shares and is called systematic or market risk • This part of the risk is undiversifiable and all investors should undertake this when including this share to their portfolios • Thus, markets reward investors only for the systematic risk of shares, since the specific risk could be eliminated in a well-diversified portfolio (total risk) = (systematic risk) + (specific risk)
Advanced Topics in Finance Risk and uncertainty FrankHynemanKnight. 1921, ‘Risk, Uncertainty & Profit’. • In equilibrium, practitioners and investors would be rewarded against the uncertainty of their portfolios’ future prices. • Random variable: a quantity, the value of which is changing over different random samples of the population that is governed by a generating process. • discrete / continuous random variables • (1-a)% confidence interval • Uncertainty: the state at which the generating process is totally unknown and there is no information regarding the corresponding probabilities of possible outcomes, ex-ante. • Risk: the state at which the generating process’s parameters are known and even if future outcomes are unpredictable they still be quantified in a stochastic framework.
Advanced Topics in Finance Sensitivity analysis NPV = f(i, NCF, Ko, n) • According to the sensitivity analysis the NPV is evaluated for changes of one of the deterministic factors ceteris paribas. • The main drawback of this method is that it is a technique which is not based on a probabilistic background. example: Assume the following investment, where the required rate of return is 13%. t0 t1 t2 t3 (51,000) 24,800 24,800 24,800 How your investment decision (NPV) would be affected by a 10% change on the variables involved in the NPV function?
Advanced Topics in Finance Sensitivity analysis Table 1 Sensitivity Analysis
Advanced Topics in Finance The modern theory of utility • Ramsey 1931 and Neumann and Morgenstern 1944 were concerned to demonstrate the superiority of the expected utility E(U), not only vis-a-vis expected monetary value but also with respect to the possible theories of behavior. • Von Neumann and Morgenstern demonstrated that if a decision maker fulfills a number of reasonable consistency requirements, the expected utility hypothesis leads to optimal results under conditions of uncertainty. More specifically, they showed that utility can be introduced into decision problems in such a way that an individual who acts solely on the basis of expected utility is also acting in accordance with his true tastes.
Advanced Topics in Finance Investor’s behavior Risk averter • An individual whose utility function is concave will be called a risk averter. The marginal utility of a risk averter declines with an increase in his wealth. • A utility function is concave when for every two possible values x1 and x2 and for all 0<a<1 the following inequality holds: U[a x1 + (1-a) x2] > a U(x1) + (1-a) U(x2) • Graphically this means that a chord connecting points x1 and x2 will be below the utility curve (concave curve). An alternative definition of risk aversion is based on the 1st and 2nd derivatives of the utility fnt: U’(x) > 0 and U’’(x) < 0. • Thus every risk averter will prefer a perfectly certain return to an uncertain one with equal expected value. It follows that a risk averter is not a gambler, and in fact will never voluntarily enter a ‘fair’ game of chance, that is one in which the expected award equals the price of participation.
Advanced Topics in Finance Investor’s behavior Risk lover • An individual whose utility function is convex will be called a risk lover. The marginal utility increases with an increase in the risk lover’s wealth. • A utility function is convex when for every pair of possible values x1 and x2 and for all 0<a<1 the following inequality holds: U[a x1 + (1-a) x2] < a U(x1) + (1-a) U(x2). • An alternative definition of a risk lover’s utility function is could be derived from the 1st and 2nd derivatives of the utility function: U’(x) > 0 and U’’(x) > 0. • It follows that a risk lover will not only accept a fair gamble, but will also accept (within specific red lines) an unfair gamble, that is, he will be willing to pay more than the expected value for a chance of winning. • The shape of a person’s utility function U(.) determines his attitude toward risk: • A risk averse individual has a concave utility function • A risk neutral individual has a linear utility function • A risk loving individual has a convex utility
Advanced Topics in Finance Commonly used utility for wealth functions • logarithmic: U(w) = a + b ln(w) • power utility fnt: U(w) = wb / b, b 0 • exponential utility fnt: U(w) = (1/a) e-aw, a>0 • quadratic utility fnt: U(w) = a + bw – cw2 • hyperbolic absolute risk aversion utility fnt HARA: , b>0 and for λ=2 quadratic for λ= -∞ exponential for λ<1, b=0 power for λ=b = 0 logarithmic
Advanced Topics in Finance Risk premium • If the expected wealth of two investments is equal, the expected utility would be different since the risk averter would be satisfied less from the risky investment. Now consider two investments, the risky and the riskless: • Riskless: certain income y • Risky: income either y+z1 (with probability p1) or y+z2 (with probability p2) Expected income Ε(y,z) = p1 (y+z1) + p2 (y+z2) Suppose that the expectation is equal to y, E(y,z)=y. The expected utility of these investments would be: • Riskless: Erisk free[U(y)] = U(y) = U[E(y,z)] = U[p1 (y+z1) + p2 (y+z2)] • Risky: Erisk[U(y,z)] = p1 U(y+z1) + p2 U(y+z2) For a risk averter investor the following inequality holds: Erisk free[U(y)] = U(y) > Erisk[U(y,z)]
Advanced Topics in Finance Risk premium Example Risk averter with logarithmic utility function, i.e. U(x) = ln(x) • Investment A: wealth = 150 • Investment B: wealth = 100 with probability 50% or 200 with probability 50% Expected income A = 150 Expected income B = p1 (y1) + p2 (y2) = 150 The expected utility of these investments would be: Erisk free[U(y)]A = U(y) = U[E(y,z)] = ln(150) = 5.010635 Erisk[U(y,z)]B = p1 U(y1) + p2 U(y2) = 0.5 * 4.60517 + 0.5 * 5.298317 = 4.951744 For a risk averter investor the following inequality holds: Erisk free[U(y)] = U(y) > Erisk[U(y,z)]
Advanced Topics in Finance Risk premium Figure 2 utility function This means that the expected utility of an investment that embeds risk would be less than the corresponding expected utility of a riskless investment with the same expected income. Erisk free[U(y)] = U(y) > Erisk[U(y,z)]
Advanced Topics in Finance Risk premium Inversely: For every risky investment corresponds a riskless investment with the same expected utility. It is obvious that the riskless investment’s income (certainty equivalent) would be less than that of the risky investment’s expected income. • For every risky investment, there exist an certain amount of money (CE) which causes the same satisfaction to the investor: U[CE(y,z)] = Erisk[U(y,z)] • This amount (CE) corresponds to the income that would make the risk averter investor to be indifferent between undertaking the risky investment or the riskless one. Figure 3 utility function Risk premium is the excess amount of money that a risk averter investor requires in order to be compensated for the risk that he is undertaking under the risky project, over the certainty amount that has no risk: Risk Premium = E(y,z) – [CE(y,z)] For each specific risky investment there exist different risk premiums that correspond to different investors’ risk aversion profiles.
Advanced Topics in Finance Joint Investments: Portfolio Management Suppose that an investor considers two investments that embed risk. The NCF of the investments are shown below: t0 t1 scenario 1 (40%) scenario 2 (60%) A (1000) 1050 1200 B (1000) 1500 1050 The cost of capital of these firms is equal to 10%.
Advanced Topics in Finance Joint Investments: Portfolio Management 1. MUTUAL EXCLUSIVE FIRMS a’ approach: t0 t1 A (1000) E(NCFA) = 1140 B (1000) E(NCFB) = 1230 NPV: NPVA = -1000 + PV{E(NCF1)} = -1000 + 1140 = 36.36 NPVB = -1000 + PV{E(NCF1)} = -1000 + 1230 = 118.18 IRR: IRRA : NPVIRR = 0 IRRA = (1140-1000) / 1000 = 14% IRRB : NPVIRR = 0 IRRB = (1230-1000) / 1000 = 23%
Advanced Topics in Finance Joint Investments: Portfolio Management 1. MUTUAL EXCLUSIVE FIRMS b’ approach: NPV: scenario 1 (40%) scenario 2 (60%) NPVA,1 = -45.45 NPVA,2 = 90.91 NPVA = 36.36 NPVB,1 = 363.64 NPVB,2 = -45.45 NPVB = 118.18 IRR: scenario 1 (40%) scenario 2 (60%) IRRA,1 = 0.05 IRRA,2 = 0.2 IRRA = 0.14 andstdIRR = 0.07 IRRB,1 = 0.5 IRRB,2 = 0.05 IRRB = 0.23 andstdIRR = 0.22
Advanced Topics in Finance Joint Investments: Portfolio Management 2. JOINT INVESTMENT – PORTFOLIO Portion of our money (wA) is invested in firm A and the remaining is invested in firm B. Portfolio: wA and wB, wA + wB = 1 So we end up with the following results
Advanced Topics in Finance Joint Investments: Portfolio Management 2. JOINT INVESTMENT – PORTFOLIO The risk-return trade-off is illustrated below: