Download
1 / 20
230 likes | 455 Vues
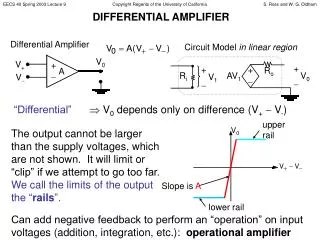
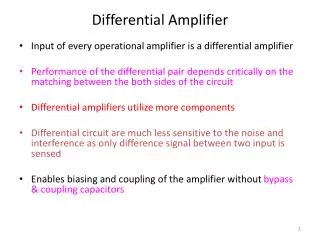
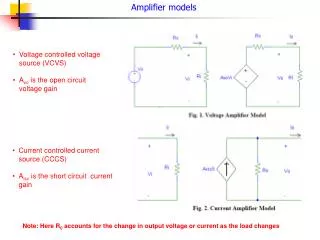
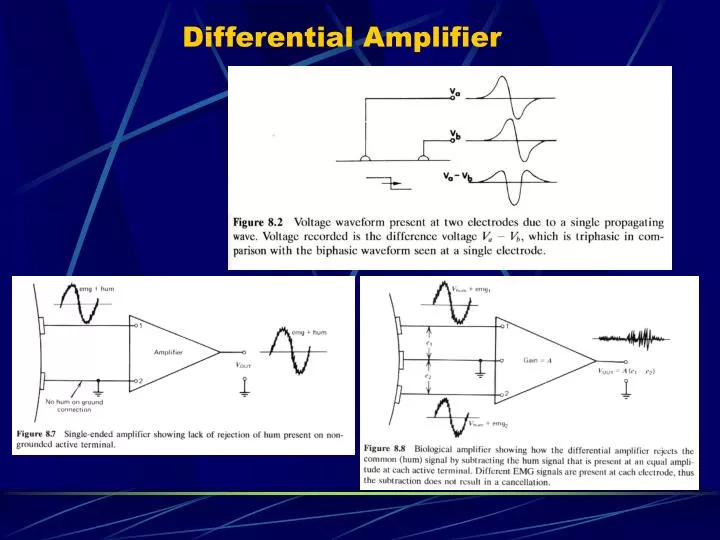
Differential Amplifier. Surface Electromyography for Noninvasive Characterization of Muscle. R Merletti, A Rainodi and D Farina. Features of Myoelectric Signal. Typical amplitude 10-500 μ V Frequency 10-400 Hz Mean Frequency 70-130 HZ Median Frequency 50-110 Hz. MonoPolar Needle.

E N D
Surface Electromyography for Noninvasive Characterization of Muscle R Merletti, A Rainodi and D Farina
Features of Myoelectric Signal • Typical amplitude 10-500 μV • Frequency 10-400 Hz • Mean Frequency 70-130 HZ • Median Frequency 50-110 Hz MonoPolar Needle
Geometrical and Anatomical Factors • Electrode size, shape, and interelectrode distance • Electrode location with respect to the innveration zone (IZ) and the muscle tendon junction • Thickness of the skin and subcutaneous layers • Misalignment between the muscle fibers and electrodes
Physiological Factors • Muscle fiber conduction velocity (CV) as a global average • Statistical distribution of muscle fiber CV (dispersion or scatter of CV around the average • Number of Motor Units (Mu’s), territory, number of fibers, fiber size, and histological type of each MU • Blood flow and temperature • Rate of metabolite production, intramuscular pH, ion concentration, and shifts across the muscle cell membrane • Type and level of contraction (iso, con, ecc, stim) • Mean and SD of interpulse intervals of the Mu’s • Degree of MU synchronization
Effects of Geometry and Physiology • The EMG signal contains information about many physical and physiological factors or variables whose contributions to the signal are not easy to separate: • Ex. 1: A change in signal amplitude from one test to another may be due to a change of electrode position, MU’s activated, thickness of subcutaneous tissue, conduction velocity, electrode alignment with the direction of muscle fibers, or level of muscle activation. • Ex. 2: The decrement in MNF or MDF during a sustained contraction may be due to a decrement of mean CV, an increase in CV dispersion, the dropout of superficial MU’s (or those with higher CV) or the recruitment of deeper ones (or those with lower CV), or the widening of the depolarization zones, a different degree of MU synchronization.
A Linear Electrode Array • When a single EMG channel is used it is not possible to separate the contributions of physiological and geometrical factors • A linear array of equally spaced electrodes makes available many EMG channels and provides additional information. • A linear array allows the identification of single MU action potentials (MUAPs), the location of innervation and tendon zones, and the estimation of CV of the individual MUAPs and of their firing patterns • A linear array is also required to learn where a single electrode pair should be located on the muscle and to determine the effects of placing it in different positions
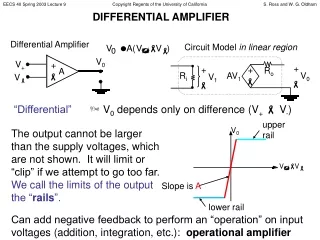
Effects of Electrode Placement on EMG • Consider the two monopolar potentials propagating in opposite directions, if a differential detection by placing one electrode on each side of the IZ the resulting voltage will be: • Small with respect to the monopolar • Sensitive to differences in shape between the two waves, which depend on the distribution of the NMJs within the IZ • Sensitive to electrode location and to the spread of CV values among MU’s • Sensitive to relative movements between the electrodes and the muscle fibers, which will alter the symmetry of the detectors relative to the IZ
Effects of Electrode Placement on EMG • Consider a differential detection by placing both electrodes on one side of the IZ the resulting voltage is the difference between to very similar monopolar time-shifted voltages and will show: • Smaller or comparable amplitude with respect to the monopolar potentials, depending on the interelectrode distance • Small sensitivity to the spatial distribution of the NMJ within the IZ because the two monopolar potentials will be equally affected by it and the effect will cancel the difference between the signals • Small sensitivity to electrode location and electrode-muscle relative movement as long as the electrodes are sufficiently distant from the IZ and termination zone • High sensitivity to CV and to CV distribution, which will affect the time duration and the time delay of the differential signals
Figure 2 Surface EMG from a biceps brachii muscle detected using a linear array of equally spaced electrodes made of silver bars 1 mm diameter, 5 mm long, and 10 mm apart. (a) Fifteen single differential channels are detected between adjacent electrodes. The firings of different Mus and the propagation and extinction of their action potentials (MUAPs) at the tendons are evident. (b) When only two electrodes are used, most information is lost, and the features of the signal are strongly affected by the electrode location with respect to the IZ. Note the small amplitude and random components of the signals detected with electrodes placed symmetrically with respect to the IZ and the larger signal detected with both electrodes on one side of such a zone. The letters labeling the traces in b refer to the electrode pairs indicated next to the array.
Fig 2a: a very small signal is detected by the seventh pair which is over the IZ • Each firing generates a well-defined propagating signal that begins at the IZ and terminates at the muscle- tendon junction • Fig 2b: Shows how signals detected with a single pair of electrodes can change depending on electrode location and distance • Pairs placed symmetrically over the IZ (B, F, G) give small noisy signals • Pairs that are on one side of the IZ give larger amplitude signals
Fig 3 shows changes in the EMG amplitude detected along an electrode array • Large variations are observed near the IZ, indicating that reliable estimate may be obtained only with electrodes placed between the innervation and tendon zones • Similar observations apply to spectral variables and CV • Because the IZ is not known a priori and it differs across individuals, the zone should be identified in each muscle and each individual using • A linear electrode array • Two adjacent pairs of electrodes and verifying that the two signals are sufficiently similar to justify the assumption of monodirectional propagation (r > .7)
Cross Correlation Technique • The Cross Correlation algorithm can be used to estimate muscle fiber conduction velocity. • The Cross Correlation technique finds the optimal time lag (+ or -) based upon the highest correlation between the two signals.
Electrode Placement • It is evident that improper electrode placement may lead to total inconsistencies in the detection of signal amplitude and spectral features • Improper electrode repositioning after training or treatment could lead to large variations of amplitude and/or spectral variables that could be attributed to the effect of training or treatment
Effects of Misalignment • Fig 4 shows a single MUAP detected with a linear array and simulated with three angles of alignment between the fiber and electrode (0, 5, 10 deg) • Depending upon the location of the electrodes along the muscle, amplitude, MNF, and MDF may be overestimated or underestimated. • Proper alignment is characterized by a symmetric waveform pattern of the action potential propagating in the two directions
Myoelectric Manifestations of Fatigue • Muscle fatigue could be considered as associated to: • Change in fiber excitability and MUAP propagation • Alteration in metabolic conditions • Failure of E-C coupling • Well known EMG-Fatigue relations: • Decrease in CV • Decrease MDF and MNF • Increase (followed by a decrease) in Amplitude
Direct Myoelectric Fatigue Parameters • Fig 5 shows a system that estimates the amplitude and spectral features from a single differential signal and CV from two double differential signals (DD1 and DD2)
Relationship Between Fiber Type and EMG-Fatigue for Median Frequency • Fig 6 shows a strong relationship between MDF and percent of type I and type II fibers in the muscle
Relationship Between Fiber Type and Muscle Fiber Conduction Velocity • Strong relationship between fiber type and muscle fiber conduction velocity
Estimation of Conduction Velocity • Fig 8 depicts a set of differential signals detected with an array electrode • The signal shows three MU’s with two IZ’s, one between pair 8 and 9 (MU’s 1 & 2) and one under pair 4 (MU 3) • It is clear that under certain electrode pairs (4, 5, 6, & 7) signals travel sometimes in one direction (when Mus 1 and 2 fire) and sometimes in the opposite direction (when MU 3 fires) • Note that a global estimation of CV based on only two electrode pairs would be completely incorrect if propagation is not always in the same direction under the electrode pairs