Download
1 / 25
250 likes | 341 Vues
Visualization Knowledge Query Language (VKQL) Workshop. Nicholas Del Rio University of Texas at El Paso Computer Science. Workshop Objectives. U nderstand notion and purpose of visualization queries Understand why writing queries may be easier that writing visualization programs

E N D
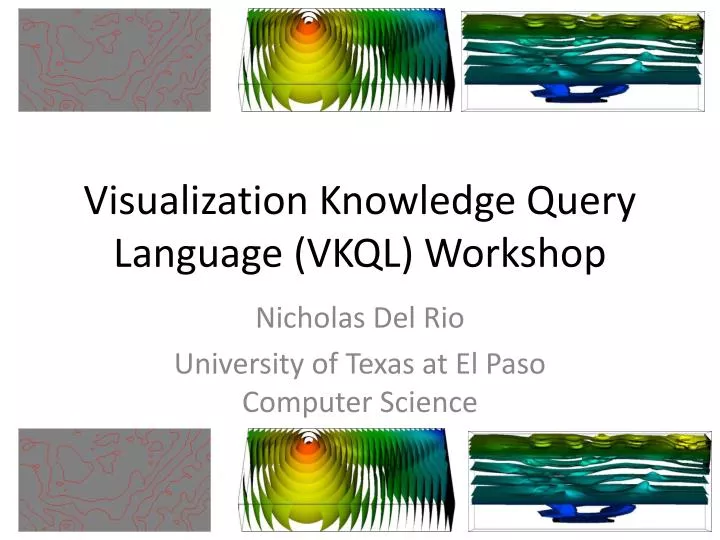
Visualization Knowledge Query Language (VKQL) Workshop Nicholas Del Rio University of Texas at El Paso Computer Science
Workshop Objectives • Understand notion and purpose of visualization queries • Understand why writing queries may be easier that writing visualization programs • Learn the VKQL syntax and practice posing queries
Workshop Summary • Generating Visualizations Imperatively • Visualization Query • VKQL Syntax and Examples • Activity 1: Manual Inspection of Query • Activity 2: Copy and Pasting Examples • Conclusion
Velocity Model Visualization • A set of isosurfaces • extracted from a seismic velocity model • Covers a region in southern New Mexico 3 km/s Depth 8 km/s
Visualizing the Velocity Model • Generated by custom Java application • relied on Visualization Toolkit (VTK) for rendering • VTK was developed for rendering 3D visualizations • VTK is supported by Sandia, Los Alamos, ARL, and others • Writing a custom visualization application: • may rely on third party package to support rendering • may need to perform some transformations on input dataset before rendering
Visualization Toolkits • Visualization Toolkit (VTK) was used to render the velocity visualization • VTK is a toolkit that provides functions such as: • Filtering • Gridding/interpolating • Mapping (i.e., transform data into views like isosurfaces) • Rendering the views • Functions are referred to as operators • Generic mapping tools (GMT): 60 operators • VTK: hundreds of operators
Visualization Pipeline Model • VTK requires that users write pipelines • the output of an operator feeds into the operator next in the pipeline sequence • first operator in pipeline is usually data reader • final operator in pipeline is usually renderer • Thus the Java program that visualizes the velocity model can be seen as a pipeline of VTK operators • It is up to the users to write these pipelines…
VTK Java Pipeline For Velocity Model vtkImageReaderrdr= new vtkImageReader(); rdr.SetFileName(inputDatasetFilePath); rdr.SetDataScalarTypeToUnsignedShort(); rdr.SetDataByteOrderToLittleEndian(); rdr.SetFileDimensionality(3); rdr.SetDataOrigin(0,0,0); rdr.SetDataSpacing(1,1,1); rdr.SetDataExtent(0,230,0,25,0,68); rdr.SetNumberOfScalarComponents(1); rdr.FileLowerLeftOn(); rdr.Update(); vtkContourFiltercontours = new vtkContourFilter(); contours.SetInput(rdr.GetOutput()); contours.GenerateValues(35,0.0,9000.0); vtkPolyDataMappercontMapper = new vtkPolyDataMapper(); contMapper.SetInput(contours.GetOutput()); contMapper.SetScalarRange(0.0,9000.0); • vtkActorcontActor = new vtkActor(); • contActor.SetMapper(contMapper); • contActor.RotateX(105); • vtkRenderer ren1 = new vtkRenderer(); • ren1.AddActor(contActor); • ren1.AddActor2D(outlineActor); • ren1.SetBackground(1,1,1); • vtkRenderWindowrenWin = new vtkRenderWindow(); • renWin.SetOffScreenRendering(1); • renWin.AddRenderer(ren1); • renWin.SetSize(300,300); • renWin.Render(); • vtkJPEGWriterimg= new vtkJPEGWriter(); • img.SetInputConnection(renWin.GetOutputPort()); • img.SetFileName(outputDatasetFilePath); • img.SetQuality(100);
Pipeline of Visualization Operators Op 5 vtkImageReaderrdr= new vtkImageReader(); rdr.SetFileName(inputDatasetFilePath); rdr.SetDataScalarTypeToUnsignedShort(); rdr.SetDataByteOrderToLittleEndian(); rdr.SetFileDimensionality(3); rdr.SetDataOrigin(0,0,0); rdr.SetDataSpacing(1,1,1); rdr.SetDataExtent(0,230,0,25,0,68); rdr.SetNumberOfScalarComponents(1); rdr.FileLowerLeftOn(); rdr.Update(); vtkContourFiltercontours = new vtkContourFilter(); contours.SetInput(rdr.GetOutput()); contours.GenerateValues(35,0.0,9000.0); vtkPolyDataMappercontMapper = new vtkPolyDataMapper(); contMapper.SetInput(contours.GetOutput()); contMapper.SetScalarRange(0.0,9000.0); • vtkActorcontActor = new vtkActor(); • contActor.SetMapper(contMapper); • contActor.RotateX(105); • vtkRenderer ren1 = new vtkRenderer(); • ren1.AddActor(contActor); • ren1.AddActor2D(outlineActor); • ren1.SetBackground(1,1,1); • vtkRenderWindowrenWin = new vtkRenderWindow(); • renWin.SetOffScreenRendering(1); • renWin.AddRenderer(ren1); • renWin.SetSize(300,300); • renWin.Render(); • vtkJPEGWriterimg= new vtkJPEGWriter(); • img.SetInputConnection(renWin.GetOutputPort()); • img.SetFileName(outputDatasetFilePath); • img.SetQuality(100); Op 1 Op 6 Op 2 Op 7 Op 3 Op 8
Different Types of Operators Op 5 Transformer vtkImageReaderrdr= new vtkImageReader(); rdr.SetFileName(inputDatasetFilePath); rdr.SetDataScalarTypeToUnsignedShort(); rdr.SetDataByteOrderToLittleEndian(); rdr.SetFileDimensionality(3); rdr.SetDataOrigin(0,0,0); rdr.SetDataSpacing(1,1,1); rdr.SetDataExtent(0,230,0,25,0,68); rdr.SetNumberOfScalarComponents(1); rdr.FileLowerLeftOn(); rdr.Update(); vtkContourFiltercontours = new vtkContourFilter(); contours.SetInput(rdr.GetOutput()); contours.GenerateValues(35,0.0,9000.0); vtkPolyDataMappercontMapper = new vtkPolyDataMapper(); contMapper.SetInput(contours.GetOutput()); contMapper.SetScalarRange(0.0,9000.0); • vtkActorcontActor = new vtkActor(); • contActor.SetMapper(contMapper); • contActor.RotateX(105); • vtkRenderer ren1 = new vtkRenderer(); • ren1.AddActor(contActor); • ren1.AddActor2D(outlineActor); • ren1.SetBackground(1,1,1); • vtkRenderWindowrenWin = new vtkRenderWindow(); • renWin.SetOffScreenRendering(1); • renWin.AddRenderer(ren1); • renWin.SetSize(300,300); • renWin.Render(); • vtkJPEGWriterimg= new vtkJPEGWriter(); • img.SetInputConnection(renWin.GetOutputPort()); • img.SetFileName(outputDatasetFilePath); • img.SetQuality(100); Op 1 Transformer Op 6 Renderer View Mapper Op 2 Transformer Op 7 Transformer Op 3 Op 8 Transformer
Operators are Parameterized Op 5 P1 vtkImageReaderrdr= new vtkImageReader(); rdr.SetFileName(inputDatasetFilePath); rdr.SetDataScalarTypeToUnsignedShort(); rdr.SetDataByteOrderToLittleEndian(); rdr.SetFileDimensionality(3); rdr.SetDataOrigin(0,0,0); rdr.SetDataSpacing(1,1,1); rdr.SetDataExtent(0,230,0,25,0,68); rdr.SetNumberOfScalarComponents(1); rdr.FileLowerLeftOn(); rdr.Update(); vtkContourFiltercontours = new vtkContourFilter(); contours.SetInput(rdr.GetOutput()); contours.GenerateValues(35,0.0,9000.0); vtkPolyDataMappercontMapper = new vtkPolyDataMapper(); contMapper.SetInput(contours.GetOutput()); contMapper.SetScalarRange(0.0,9000.0); • vtkActorcontActor = new vtkActor(); • contActor.SetMapper(contMapper); • contActor.RotateX(105); • vtkRenderer ren1 = new vtkRenderer(); • ren1.AddActor(contActor); • ren1.AddActor2D(outlineActor); • ren1.SetBackground(1,1,1); • vtkRenderWindowrenWin = new vtkRenderWindow(); • renWin.SetOffScreenRendering(1); • renWin.AddRenderer(ren1); • renWin.SetSize(300,300); • renWin.Render(); • vtkJPEGWriterimg= new vtkJPEGWriter(); • img.SetInputConnection(renWin.GetOutputPort()); • img.SetFileName(outputDatasetFilePath); • img.SetQuality(100); P7 Op 1 P2 Op 6 P3 P8 P4 Op 2 Op 7 P9 P5 Op 3 Op 8 P6
Declarative Requests • Many user skills needed to visualize data • Aside from cognitive aspects of visualization, a large part of the problem is engineering • Stems from fact that we generate visualizations imperatively (i.e., write code) Can we provide a means for users to generate visualizations declaratively (i.e., generatewhat visualization they want without having to write code)?
Workshop Summary • Generating Visualizations Imperatively • Visualization Query • VKQL Syntax and Examples • Activity 1: Manual Inspection of Query • Activity 2: Copy and Pasting Examples • Conclusion
Visualization Query • The velocity model visualization was actually a result of a visualization query Requested Visualization Desired View URL of Data to visualize Format of dataset Semantic Type of dataset WDO types (UTEP) Parameter Argument Viewer
Visualization Queries and SQL • Visualization queries mirror SQL queries • query request is specified declaratively • request is then translated into a query plan • query plan computes the result requested by the query • Information specified in visualization queries is used to derive pipelines rather than query plans • The pipeline in turn generates the visualization requested in the query
Information Needed to Write Queries • At a minimum you need to know: • The type of your dataset (e.g., gravity, seismic) • The format it is stored in (e.g., netCDF) • The URL of your dataset • With only above info, all possible visualizations will be returned (wildcard) • For more control, you need to know: • What view you want (i.e., chart, isolines, volume) • The appropriate values for operator parameters
Workshop Summary • Generating Visualizations Imperatively • Visualization Query • VKQL Syntax and Examples • Activity 1: Manual Inspection of Query • Activity 2: Copy and Pasting Examples • Conclusion
VKQL Syntax • A conjunction of Prolog statements that contain: • hasView( -DATA, ?VIEW) • hasContent(-DATA, +URL), • hasType(-DATA, +TYPE), • hasFormat(-DATA, +FORMAT) • [hasValue(+PARAM, +VALUE)]
Workshop Summary • Generating Visualizations Imperatively • Visualization Query • VKQL Syntax and Examples • Activity 1: Manual Inspection of Query • Activity 2: Copy and Pasting Examples • Conclusion
Activity 1: Manual Inspection of Query • Navigate to: http://trust.utep.edu/visko/vkql-examples/ • Refer to the first query specified on the page: • What viewer is the query requesting the system to target? • What view is the query requesting the system to generate? • What is the type and format of the dataset being visualized? • Are there any parameter bindings? If so what is the parameter bound to?
Workshop Summary • Generating Visualizations Imperatively • Visualization Query • VKQL Syntax and Examples • Activity 1: Manual Inspection of Query • Activity 2: Copy and Pasting Examples • Conclusion
Submitting VKQL Queries • VKQL queries can be entered and executed at: http://trust.utep.edu/visko/vkql/ • You can build queries by selecting values from combo boxes • You can type queries manually in a text box without any guidance or copy and paste an existing query
Activity 2: Pasting Examples • Navigate to: http://trust.utep.edu/visko/vkql-examples/ • Copy query for: Gridded Time with Rotation • Paste and Submit Query in Query Submission Page • Try manually changing the values assigned to: • xRotation • yRotation • zRotation • Resubmit with new bindings
Workshop Summary • Generating Visualizations Imperatively • Visualization Query • VKQL Syntax and Examples • Activity 1: Manual Inspection of Query • Activity 2: Copy and Pasting Examples • Conclusion
Conclusion • Writing queries may be easier to request for visualization generation than writing imperative code • VKQL Queries can be constructed a few ways using the VKQL Query Submit interface • VKQL Queries can target more than a single toolkit for generation