Download
1 / 4
40 likes | 42 Vues
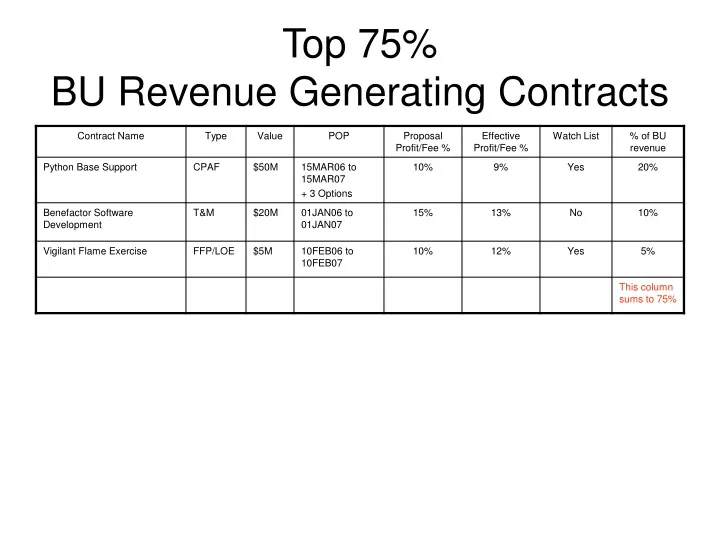
Top 75% BU Revenue Generating Contracts. Top 75% BU Revenue Generating Contracts. Directions: Calculate % of revenue for all contracts in BU. Present the fewest number of contracts here, whose combined % of BU revenue equals 75%. Watch List:

E N D
Top 75% BU Revenue Generating Contracts Directions: • Calculate % of revenue for all contracts in BU. • Present the fewest number of contracts here, whose combined % of BU revenue equals 75%. Watch List: • Identify contracts that meet the following proposal criteria (and were therefore subject to corporate oversight according to the authority matrix CO 201 Attach 1): • FP > $5M • CPFF, CPAF, T&M, FFP/LOE > $50M • Bid below profit/fee thresholds • CPAF 10% • CPFF 8% • FFP/LOE 12% • FFP/Comp 15% • T&M 9%
Top 75% Performance • These are carried over from previous chart • Up/Down arrow indicates direction of trend
Program Risk: Staffing issues (G/Y/R) Cure notice (R) Show cause (R) Negative CPAR (Y/R) OCI issues (G/Y/R) Funding Risk 30 day notices for 75% expenditure Financial reporting (deliverables) Funding timeliness issues Incremental/full funding issues LOE/Burn Where you are in your funding expenditures compared to your negotiated plan and/or contract value Green: +/- 0-5% Yellow: +/- 6-10% Red: > 10% SV($) – Schedule Variance SV($) = BCWP - BCWS or EV – PV Measured in $’s > 0 means ahead of schedule (G) = 0 means on schedule (G) < 0 means behind schedule (Y/R) CV($) – Cost Variance CV($) = BCWP - ACWP or EV - AC > 0 means under budget (G) = 0 means on budget (G) < 0 means over budget (Y/R) Get Well Plan How you are addressing your performance issues Top 75% Performance