Download
1 / 55
660 likes | 974 Vues
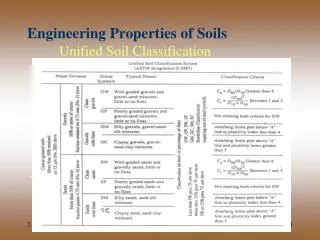
Unified Soil Classification System Training. Sections of Course. Part A - Terms and Definitions Part B - USCS using Laboratory Data Part C - USCS using Field Techniques. Objectives. Define terms important for Unified Soil Classification System. Percent Fines Mechanical Analysis

E N D
Sections of Course • Part A - Terms and Definitions • Part B - USCS using Laboratory Data • Part C - USCS using Field Techniques
Objectives • Define terms important for Unified Soil Classification System • Percent Fines • Mechanical Analysis • Liquid Limit • Plastic Limit, Plasticity Index • Water Content • Organic
Objectives • Using supplied laboratory data, correctly classify soils by USCS • Correctly classify soils in field situations by USCS
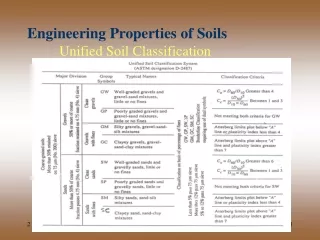
Background • The Unified Soil Classification System was an outgrowth of the Airfield Classification System • Grouping is based on engineering properties
USDA Textural Classification • USDA Textural System only considers grain size. • Clay mineralogy and how it affects water holding and plasticity characteristics are not evaluated with this classification system
Engineering Properties • Permeability • Shear Strength • Consolidation • Shrink/Swell
Parameters Used in Classification System • Particle Size • Water Holding and Plasticity • Organic Content
ASTM Standards • Lab Data Classification is byASTM D2487 • Classification of Peat Samples, see ASTM D 4427 • Field Classification is by D2488
Definitions • Particle Sizes • Gradation or Mechanical Analyses • Sieves for larger particles • Hydrometer for fine particles
Sieve Designation - Large Sieves larger than the #4 sieve are designated by the size of the openings in the sieve
Commonly used larger size sieves 3 inch 2 inch 1-1/2 inch 1 inch 3/4 inch 1/2 inch 3/8 inch Review Activity 2
1-inch Sieve Designation - Smaller Smaller sieves are numbered according to the number of openings per inch 10 openings per inch # 10 sieve
Commonly used smaller size sieves # 4 # 10 # 20 # 40 # 60 # 140 # 200 Review Activity 3
Activity 4, 5 & 7 (skip 6) • Class Exercise - Convert weights retained to percent retained • Convert percent retained to percent finer • Plot Data on Form
# 20 81 Grain-size Distribution Sieve Designation % Finer Grain Size, millimeters (log10)
Particle Size Definition • System based only on particles smaller than 3-inches • Cobbles are 3”to 12” • Boulders are > 12”
Gravel / Sand / Fines • Gravels are between # 4 sieve and 3” • Sands are between # 200 sieve and # 4 sieve • Fines are smaller than # 200 sieve
Parameters Used in Classification System • Particle Size • Water Holding and Plasticity • Organic Content
Tests to Define Boundaries • Water Content - Definition • Ratio of the weight of water in a sample to the weight of the dry soil • Expressed as a percentage • Values greater than 100 % possible
Increasing Water Contents Water Holding and Plasticity • Consistency States of Finer Particles • Liquid • Plastic • Semi-solid • solid
Activity 9 Consistency States
Tests to Define Boundaries • Tests are only performed on the fraction of a sample that is finer than the # 40 sieve.
Liquid Limit Definition • The water content at which a soil changes from a plastic consistency to a liquid consistency • Defined by Laboratory Test concept developed by Atterberg in 1911.
Liquid Limit Definition • The water content at which a groove cut in a soil paste will close upon 25 repeated drops of a brass cup with a rubber base
LL Test Procedure • Prepare paste of soil finer than # 40 sieve • Place Soil in Cup
LL Test Procedure • Cut groove in soil paste with standard grooving tool
LL Test Procedure • Rotate cam and count number of blows of cup required to close groove by 1/2”
LL Test Procedure • Perform on 3 to 4 specimens that bracket 25 blows to close groove • Obtain water content for each test • Plot water content versus number of blows on semi-log paper
25 LL Test Results Interpolate LL water content at 25 blows Log N LL= w% water content, %
Activity 10 Liquid Limit Problem
LL Values < 16 % not realistic PI, % Liquid Limit, % 16
H 50 LL Values > 50 - HIGH PI, % Liquid Limit, %
L 50 LL Values < 50 - LOW PI, % Liquid Limit, %
Plastic Limit Definition • The water content at which a soil changes from a plastic consistency to a semi-solid consistency • Defined by Laboratory Test concept developed by Atterberg in 1911.
Plastic Limit Definition - Activity 11 • The water content at which a 1/8”thread of soil can be rolled out but it begins to crack and cannot then be re-rolled
Plastic Limit w% procedure • Using paste from LL test, begin drying • May add dry soil or spread on plate and air-dry • Occasionally evaluate 1/8” thread
Plastic Limit w% procedure • When point is reached where thread is cracking and cannot be re-rolled to 1/8” diameter, collect at least 6 grams and measure water content. Defined plastic limit
w% PL LL PI = LL - PL Definition of Plasticity Index • Plasticity Index is the numerical difference between the Liquid Limit w% and the Plastic Limit w%
Definition of Plasticity Index • It represents the range in water contents over which a soil behaves in a plastic manner w% PL LL semi-solid PI = LL - PL liquid plastic (remoldable)
Definition of Nonplastic • If the soil has a PI of zero, or either of the Atterberg tests cannot be performed, the soil is said to be non-plastic
Complete Activity 13 Comprehensive Review Terms and Definitions
Plastic soils plot above the A-Line on a Chart Plastic Soils Definition of Plasticity “A- Line”
Non-plastic or slightly plastic soils plot below the A-Line on a Chart Nonplastic Soils Definition of Plasticity “A- Line”
Correct tests never plot above U-line and LL values are never < 16 Unrealistic 16 U-Line Significance “U- Line”