Download
1 / 16
160 likes | 251 Vues
Cumulative Risk Prioritization Tool. Prioritizing Cumulative Inhalation Risks and Developing Solutions. Community Issues:. Is the air I breath safe? Is the water I drink safe? Is the food I eat safe?

E N D
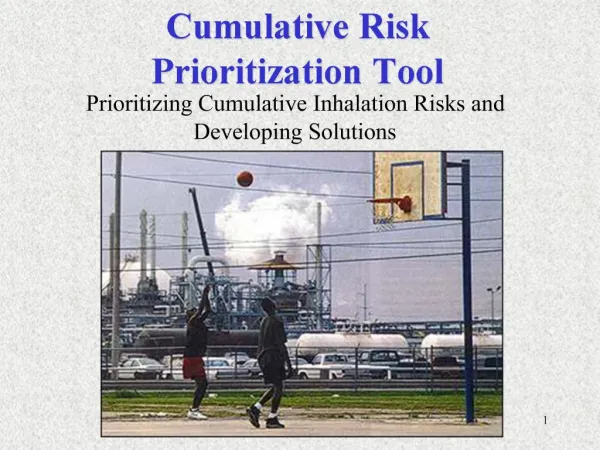
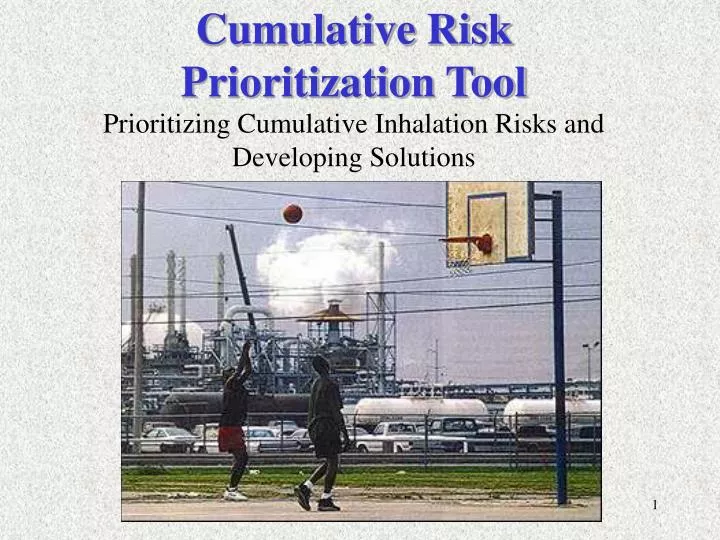
Cumulative Risk Prioritization Tool Prioritizing Cumulative Inhalation Risks and Developing Solutions
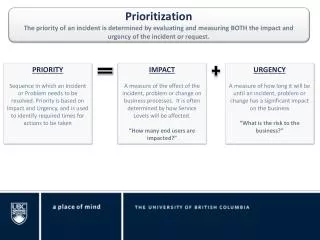
Community Issues: • Is the air I breath safe? • Is the water I drink safe? • Is the food I eat safe? It is possible to have facilities/geographic areas meeting all state and Federal rules yet still have unhealthy air?
Regional Air Impact Modeling Initiative (RAIMI) Region 6 developed a tool to answer these questions: • Assesses “community-level” inhalation impact • Can evaluate an unlimited number of stationary and mobile sources
Regional Air Impact Modeling Initiative (RAIMI) What’s different from past efforts? • Attributes impact back to individual compounds and individual emission sources • Serves as platform for strategic and tailored environmental actions—facilitates solutions
What is the level of expertise and effort required? • Knowledge of emissions data • Expertise in air dispersion modeling • Understanding of model sensitivities • Understanding of risk results
How Accurate is this? • Emissions inventories vary in completeness/data quality • Source locations are critical and often incorrect in inventories • Simple exposure scenarios utilized – 30 year, 350 day, outdoor • Process upsets usually not included or characterized • Air dispersion/risk model consistency • Comparison to air monitors for pilot study have indicated predicted results within 20% of monitored results
GIS Platform Example Case Study – Port Neches, Texas • History • CEP shows Jefferson County, as having the highest potential for exposure in Region 6 • Context • 16 Major industrial facilities • 1,500 Point source emissions • 82 Area and mobile source categories • 188+ HAPs • Findings • Identified and prioritized 2 facilities • Identified and prioritized 5 point sources • Identified local data gaps • Prioritized 1 area and 2 mobile emission source categories
Define Assessment Scope – County vs. Community Level Resolution
Results Transparency to Support Prioritization Groves Jefferson County, Texas Cumulative Inhalation Cancer Risk Profile for Residential Area Beaumont Nederland
Results Resolution to Support Prioritization and Verification – Source Attribution Profiling (Zoom) Identified source was shared with TCEQ, source impacts validated by mobile monitoring, solution (covering wastewater impoundment) was negotiated. Jefferson County, Texas Cumulative Inhalation Cancer Risk Profile for Residential Area
Results Resolution to Support Verification and Legal Review – Source Attribute Tracking (Sample) Source Attribute Table Source Attribute Table Account No. Account No. JE0017A JE0017A Account Name Ameripol Synpol Corp. Account Name Ameripol Synpol Corp. Site Name WasteWater Site Name Trap 4 – XS99 Facility Name Waste water system FacilityName ETFStyreneTank Source Type Fugitive Plant ID Tank Sector 9989A Point Name WTWTR DISCH TO RT Point Name NE1 Unique Pt Name JE0F011 Unique Pt Name JE0F00M EPN Wastewater EPN T-ESTY FIN F-WWATER FIN TANKS-ESTY Permit Status RCRA Permit No. 988A Permit Status RCRA – Permit No. 988A SIC Code -- SIC Code -- Facility Contact Bob Smith 222-222-2222 Facility Contact Bob Smith – 222-222-2222 Emissions Profile (TPY) Emissions Profile (TPY) Contaminant Actual Annual Actual Allowable Contaminant Actual Annual Actual Allowable 1,3-Butadiene 11.87 N/A 1,3-Butadiene 1.78 N/A Styrene 11.42 N/A Styrene 0.67 N/A
How to Use Results • Conduct Risk-Based Prioritizations • Complements National-Scale Assessments • Identify Risk Trends • Determine Significance of Data Gaps • Track Emissions Reduction Efforts • Support Monitoring Programs
RAIMI COMPONENTS Example Population Maps: Ethnicity
Nighttime Population Distribution Land Scan USA Population Data Diurnal population distribution is critical to understanding the localized nature of exposure. More than 160,000 people occupy this downtown tract during a typical workday. The same area is almost deserted during nighttime hours. Daytime Population Distribution
Summary • Focus is on identifying individual sources for targeted reductions, not simply identifying areas of concern • Initial findings: a small number of sources/ chemicals result in majority of impact