Download
1 / 24
270 likes | 473 Vues
Practical Absorbance and Fluorescence Spectroscopy. Chapter 2. Wavelengths. UV 10 – 400 nm Visible 400 – 700 nm Near IR 700 – 3000 nm When electronic bands are at high energy, the choromphore can absorb in the UV but not appear coloured. Absorption and Fluorescence. Absorption

E N D
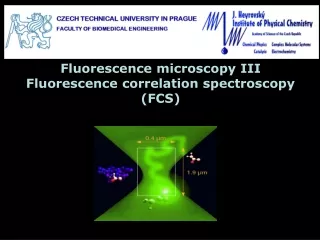
Practical Absorbance and Fluorescence Spectroscopy Chapter 2
Wavelengths UV 10 – 400 nm Visible 400 – 700 nm Near IR 700 – 3000 nm When electronic bands are at high energy, the choromphore can absorb in the UV but not appear coloured.
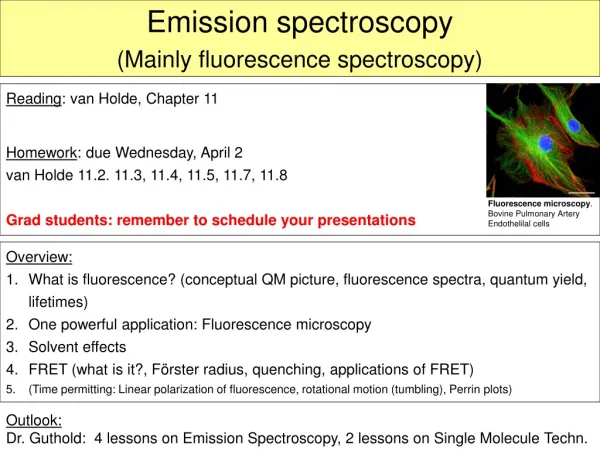
Absorption and Fluorescence Absorption A single electron being promoted to a higher energy orbital on absorption of a photon. Fluorescence Absorption whereby the energy is lost by emitting a photon rather than through heat.
Basic Layout of a dual-beam UV-visible absorption spectrometer Rotating Wheel Sample Monochromator Lamp Detector Mirror Reference
Absorbance and Beer-Lambert Law Extinction Coefficients & Transition Types Π Π* > 104 CT 103 – 105 d d 10 – 500 orbital angular momentum forbidden d d < 10 also spin forbidden
Basic Layout of a Fluorimeter PMT Sample Monochromator Excitation Lamp Spectrum of Emission Monochromator Excitation spectrum should look like absorption Emission PMT
Radiation Sources Morgan. T. 2014 Summary of Lamps, www.che-revision.weebly.com
Wavelength Selection Absorption Filters Combine to select narrow bands of frequencies Interference Filters Relies on optical interference
Monochromators Do you know the different types of dispersive elements? Morgan. T. 2014 Summary of Mountings, www.che-revision.weebly.com
Slits (giggedy) Slits Controls luminous flux from monochromator Also controls spectral bandwidth Spectral Bandwidth Monochromator cannot isolate a single wavelength. A definite band is passed. Long narrow slit with adjustable width allowing selection of bandwidth.
Monochromator Performance • Resolution • Distinguish adjacent features depends on dispersion • Purity • Amount of stray or scattered radiation • Light Gathering Power • Improved by power of source, but compromised by narrower slit to maintain resolution
Monochromator Performance Houston – we have a problem! Large bandwidth bad Low output intensity also bad Fight for the two! Also small slit width decreases S/N ratio
Dispersion Spread of wavelengths in space D-1 : Linear reciprocal dispersion, defined as the range of wavelengths over a unit of distance Lower value = better dispersion dx ~ fdθ (f = focal length)
Resolution Resolving Power – distinguish separate entities etc … where = average wavelength where w-1 is effective slit width Small f/number = greater radiation gathering power
Detectors Transducers that converts electromagnetic radiation into electron flow Uses Photoelectric Effect E = hv – w (w = work function) Need to know the different types of detectors Morgan. T. 2014 Summary of Mountings, www.che-revision.weebly.com
Fluorescence in Detail Excited electronic state Fluorescence only occur from v = 0 state of S1 to any sub-level of S0 Ground electronic state
Fluorescence in Detail Fluorescence emission photons have lower energy than excitation. Implies that fluorescence intensity proportional to I0. True; but in practise there is a limit! Only true for low concentrations.
Inner Filter Effect Results to Non-Linearity Fluorescence reduces at high concentrations For both emission and excitation
Fluorescence Lifetimes Typical lifetime around 1 – 10 ns Where τf is fluorescence emission litetime
Fluorescence Quantum Yields Φf = fluorescence quantum yield Fraction of excited state molecules that decay back to ground state via fluorescence photons Between 0 – 1 Polar environments reduce Φf Φf also very dependent on ionisation (switch from fluo to non-fluo etc…)
Stern – Volmer Plot Quenching
Cuvettes EDC Quartz 200 – 2800 nm Optical Glass 300 – 2600 nm ES Quartz 190 – 2000 nm IR Quartz 300 – 3500 nm Therefore for UV <300 nm, need quartz not glass. Plastic can be used in visible (polystyrene is fluorescent; PMMA ‘poly(metyl methacrylate)’ used instead)