Download
1 / 22
220 likes | 323 Vues
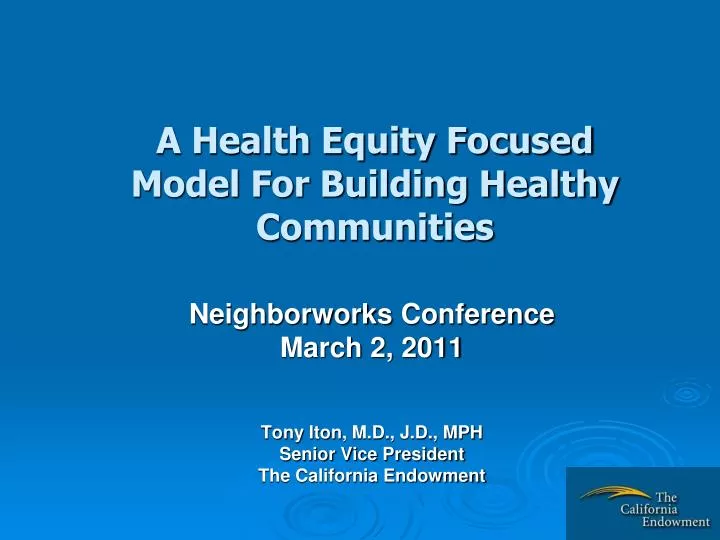
A Health Equity Focused Model For Building Healthy Communities. Neighborworks Conference March 2, 2011 Tony Iton , M.D., J.D., MPH Senior Vice President The California Endowment. Health ≠ Health care. Where You Live Matters. It Matters A LOT!. Lyndhurst 88.5. Hough 64.0.

E N D
A Health Equity Focused Model For Building Healthy Communities Neighborworks Conference March 2, 2011 Tony Iton, M.D., J.D., MPH Senior Vice President The California Endowment
Health ≠ Health care Where You Live Matters It Matters A LOT!
Lyndhurst 88.5 Hough 64.0
Cost of Poverty in San Francisco Bay Area • Every additional $12,500 in household income buys one year of life expectancy • (Benefit appears to plateau at household incomes above $150,000) • Similar gradients in Baltimore, NYC, Philadelphia, Hennepin County (Minneapolis-St. Paul), Colorado, California, AND Cuyahoga County ($6304/year of life)
Philadelphia Cuyahoga County Hennepin County Bay Area Colorado Alameda County California Los Angeles County Social Gradients Various Jurisdictions 1,400 1,300 1,200 1,100 1,000 Age-Adjusted Mortality Rate 900 800 700 600 500 <10% 10%-19.9% 20%-29.9% 30+% Neighborhood Poverty Group
A 30 year longitudinal study of nearly 7000 Alameda County residents from 1965 forward. Those residents with household income 1 SD above mean were 25% less likely to die prematurely, 1 SD below mean were 35% more likely to die early.
Health Inequities Health Disparities Family & Culture
Family & Culture Values Policy Place
Contact Information Tony Iton, MD, JD, MPH Senior Vice President The California Endowment aiton@calendow.org 510 271-4310