Download
1 / 1
10 likes | 133 Vues
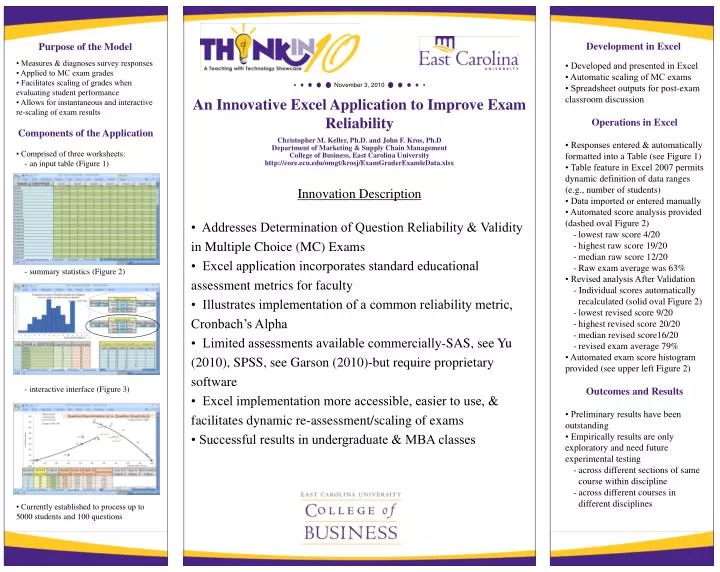
Development in Excel. Purpose of the Model. • Measures & diagnoses survey responses • Applied to MC exam grades • Facilitates scaling of grades when evaluating student performance • Allows for instantaneous and interactive re-scaling of exam results Components of the Application

E N D
Development in Excel Purpose of the Model • • Measures & diagnoses survey responses • • Applied to MC exam grades • • Facilitates scaling of grades when evaluating student performance • • Allows for instantaneous and interactive re-scaling of exam results • Components of the Application • • Comprised of three worksheets: • an input table (Figure 1) • summary statistics (Figure 2) • interactive interface (Figure 3) • • Currently established to process up to 5000 students and 100 questions • • Developed and presented in Excel • • Automatic scaling of MC exams • • Spreadsheet outputs for post-exam classroom discussion • Operations in Excel • • Responses entered & automatically formatted into a Table (see Figure 1) • • Table feature in Excel 2007 permits dynamic definition of data ranges (e.g., number of students) • • Data imported or entered manually • • Automated score analysis provided (dashed oval Figure 2) • lowest raw score 4/20 • highest raw score 19/20 • median raw score 12/20 • Raw exam average was 63% • • Revised analysis After Validation • - Individual scores automatically recalculated (solid oval Figure 2) • lowest revised score 9/20 • highest revised score 20/20 • median revised score16/20 • revised exam average 79% • • Automated exam score histogram provided (see upper left Figure 2) • Outcomes and Results • • Preliminary results have been outstanding • • Empirically results are only exploratory and need future experimental testing • across different sections of same course within discipline • across different courses in different disciplines An Innovative Excel Application to Improve Exam Reliability Christopher M. Keller, Ph.D. and John F. Kros, Ph.D Department of Marketing & Supply Chain Management College of Business, East Carolina University http://core.ecu.edu/omgt/krosj/ExamGraderExamleData.xlsx Innovation Description • Addresses Determination of Question Reliability & Validity in Multiple Choice (MC) Exams • Excel application incorporates standard educational assessment metrics for faculty • Illustrates implementation of a common reliability metric, Cronbach’s Alpha • Limited assessments available commercially-SAS, see Yu (2010), SPSS, see Garson (2010)-but require proprietary software • Excel implementation more accessible, easier to use, & facilitates dynamic re-assessment/scaling of exams • Successful results in undergraduate & MBA classes