Download
1 / 23
240 likes | 398 Vues
Table Lens. Introduction to the Table Lens concept Table Lens Implementation Projected Usage Scenarios Usage Comparison with Splus Critical Analysis. Interfacing with Tables. Tables as a common representation Regularized content Instance vs. Value Layout

E N D
Table Lens • Introduction to the Table Lens concept • Table Lens Implementation • Projected Usage Scenarios • Usage Comparison with Splus • Critical Analysis
Interfacing with Tables • Tables as a common representation • Regularized content • Instance vs. Value Layout • Large raw tables are uninterpretable
Table Views • Two common modes of interface • Focus: User examines as many fields as will fit on her screen (660 cells) • Sacrifices relationships for detail • Context: A generated representation of broad dataset it examined • High-level interpretation with no specifics
Table Lens • Lenses are devices which focus attention on part of a large context • Table Lens allows both Focus and Context views simultaneously • Tables are regular • Deformations are also regular • Lensing creates categories of detail
Categories of detail • Central areas of lens have highest levels of detail • Row and Column focal have less detail • Non-focal areas have sharply reduced detail but are still present
Degree of Interest • Detail categorization and Visualization based on Degree of Interest calculation • DOI Translates to cell size along 2 independent axes • Binary correspondence in each dimension
Table Lens Benefits • Table Lens can display both focus and context • Much more data can be displayed at once • 30 – 100 times basic spreadsheet • Allows simultaneous view of: • Variable value distribution shape • Inter-variable correlation • Specific instance values • Outlier identification
Table Lens Implementation • Interactive manipulation of focus – Atomic operations • Zoom: Enlargement of focal area • Ajust: Expansion of focal contents • Slide: Positioning of focal area • Composite manipulation • Adjust-zoom: Adds items to focus while expanding focal area
Multiple Foci • Multiple focal areas are supported • Important use modifications • Adjust corrupts display • Zoom required to be global
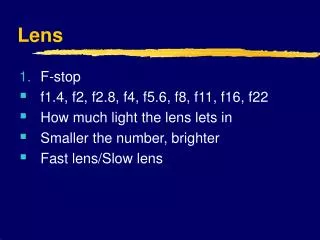
Graphical Cell Representation • Presentation factors • Value • Value Type • DOI (Region) Type • Cell Size • User Choices • Spotlighting
Other Features • Ascending/Descending Sorting • Spotlighting • Formula compilation • Median, Quarter, Extents Selection
Table Lens facilitates • Correlation of variable value curves • Outlier identification/interrogation • Variable nesting identification • Ease of use (Simple!)
Usage Comparison • Exploratory Data Analysis (EDA) • Sensemaking • “Activities in which external representations… are interpreted into semantic content and represented in some other manner”
EDA Tasks • Batch Assessment • Determining structure of information and its irregularities • Variable modeling • Finding formulaic expression for variable values
Learning Loop • Steps: • Search for representation of regularities • Encoding information into representation • Altering representation to accommodate outliers • Use of representation for discovery
Table Lens vs Splus • Estimating utility of application approach • Required time to perform tasks • Benchmark times • Empirical times • Qualitative Considerations • Ease of use • Complexity vs Return
Time-cost for important properties of all variables • Table Lens superior for iterative analysis • Splus faster for random access
Time-cost for related variables • Table Lens superior when several clusters can be grouped and eliminated early • Splus more effective when broad dataset must be analyzed
Learning costs • Table Lens performs within significant margins as well as Splus • Table Lens is much simpler than Splus