Download
1 / 28
280 likes | 433 Vues
Global Development Finance 2001. Building Coalitions for Effective Development Finance. The context. Global uncertainties in the short-term deceleration of growth emerging market crises heightened interaction between financial markets and real economy Strong medium-term prospects

E N D
Global Development Finance 2001 Building Coalitions for Effective Development Finance
The context • Global uncertainties in the short-term • deceleration of growth • emerging market crises • heightened interaction between financial markets and real economy • Strong medium-term prospects • technology • policy flexibility • greater commitment to global challenges
This presentation covers • The macro outlook • Private capital flows • Trends • Implications for developing country growth • Concessional resource transfers • Trends and effectiveness • Debt relief • International public goods
Macro outlook • Sharp slowdown • Early recovery • Important risks
Sharp slowdown in world GDP growth(percent change) Developing World Industrial Source: World Bank data and projections.
Cycle should be short-lived • Interest rate reductions • Anticipation of tax cut in U.S. and Europe • Technology helps shorten inventory cycle
Diversity in regional growth performance Source: DECPG staff estimates.
Risk factors United States NASDAQ (rhs) Percent Delinquency rates (lhs) Index Japan TOPIX (rhs) Debt of failed businesses (lhs) ¥ trillion Index
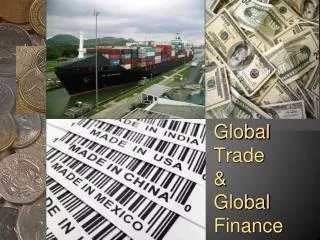
Trends in capital flows • Capital flows down relative to GDP • Developing countries improve creditworthiness • But lose share of global flows
Private capital flows in relation toGDP and trade Thailand Crises Mexico Russia Brazil Private capital flows/ Recipients’ exports Private capital flows/ Recipients’ GDP Note: Private capital flows are net of amortization.
Reduced external vulnerability a. Short-term debt and total debt are as of September 2000. Source: Bank for International Settlements, Global Development Finance Country Tables and sources cited therein, IMF International Financial Statistics and World Bank staff estimates.
Developing countries lose share in international FDI FDI Mergers and acquisitions Note: Top 10 refers to the developing countries with the largest FDI (or M&A) flows.
Private flows and growth • Private capital flows reinforce growth • Volatility has high costs • No “race to the bottom”
Capital flows to GDP ratio (percent) Top 10* Middle income Low income * Refers to the ten developing countries with the largest net capital flows. Note: Capital flows are net of amortization.
Growing divergence between middle and low income countries(annual GDP growth rates) * Refers to the ten developing countries with the largest net capital flows.
Capital flows volatility reduces growth Note: The regression line controls for other determinants of growth
Pollution levels have fallen, while FDI has increased: Sao Paulo State, Brazil
More aid and more effective aid • Slight rise in aid flows since 1997 • Better policy performance • Better aid allocation
Aid has risen modestly since 1997 * Net of technical cooperation grants.
Improved policy performanceover the 1990s Source: DECPG staff estimates.
Poor performers received less aid Between 1992 and 1994, on average, poor performers received more aid than better performers... ...In 1998 poor performers are receiving less aid than better performers. Source: OECD and World Bank.
The increasing coordination challenge Note: The Theil index in Panel C is a statistical measure of the extent of concentration of aid by sector. Higher values of the index indicate that aid is spread over a greater number of sectors. Source: OECD Development Assistance Committee.
The Heavily Indebted Poor Countries initiative • A new start: quicker pace, more relief • Tie to policy reform: key for success. • Eventual cost of initiative: $28.6 billion (net present value).
The declining HIPC debt burden Note: Ratios for 1998 and 1999 are debt service paid to exports or revenue: ratios for 2000 onwards are debt service due after HIPC assistance to exports or revenue. Data refers to the 22 HIPCs that reached decision points by end-December. Source: Country authorities and World Bank/IMF staff estimates.
International public goods • $5 billion a year of aid flows • Growing trend • But incentives more important than finance
Growing share of development assistance to international public goods
Principles for public goods • Complementarity • Leverage • Incentives for responsible action
The agenda • Investment climate • Volatility safeguards • More aid: better performers & the poor • More donor specialization & coordination • High leverage in public goods provision • IFIs: specialization, subsidiarity, convening role.