Download

1 / 34
340 likes | 507 Vues
Dust modelling in HiGAM Presentation for DUST workshop, Reading 26 th Feb 2008. Margaret Woodage Environmental Systems Science Centre University of Reading, U.K. UK-HiGEM Project.

E N D
Dust modelling in HiGAM Presentation for DUST workshop, Reading26th Feb 2008 Margaret Woodage Environmental Systems Science Centre University of Reading, U.K.
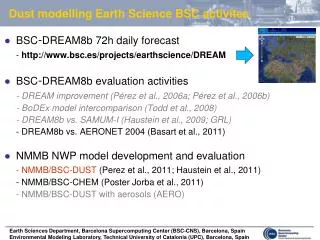
UK-HiGEM Project • Started Jan 2004, collaborative project (involving HC, NCAS, BAS, CEH, ESSC, NOCS, UEA) aiming to build a High-resolution Global Environmental Model for the NERC community. • Based on new UKMO Hadley Centre climate model HadGEM1a, with resolution increased to N144 (atmos) and 1/3 deg (ocean) • Run on the HPCx computer, Edinburgh and also by the UJCC on the Earth Simulator, Yokohama • Latest coupled experiment (run by Len Shaffrey) has completed 70 model years on HPCx and several papers are in preparation.
UK-HiGEM Project • I have run atmos-only (HiGAM) paired experiments with interactive dust modelling included; dust is either radiatively active or passive, aiming to see how dust behaves in model at higher resolution: • What does model do with dust? Can horizontal and vertical distributions be modelled realistically, and time and space scales of dust storms be accurately represented? • How does dust feed back on model climatology? How are monsoons, Easterly waves and tropical cyclones affected by dust?
Model Dependence and Tuning of Dust Dust code is strongly model dependent (also “real world” dust is very sensitive to meteorological conditions, hence very episodic, spatially and temporally variable) • Tuningis required to produce realistic dust burdens whenever model changes are made Dust generation equn: U_thresh=0.2log10(Drep) + BW + C where Drep is representative particle diameter, W is soil moisture, B and C are tunable parameters ( for HiGAM B = 0.15, C = -0.7 ) Need to look at: total annual mean burdens (20-40 Tg) season of max and min burdens (JJA max) regional distributions (over Africa, Arabia, China etc) and ‘background’ loading in remote areas size division containing peak mass (div 4, ~1-3 micron)
Diurnal cycle for Bodele 1-10 Feb (3hrly data)Tsurf, 925mb and 10m wind, Dust emissOLR, PMSL, cloud, dust load
Diurnal cycle for Zouerate 21-30 July (3hrly data)Tsurf, 925mb and 10m wind, Dust emissOLR, PMSL, cloud, dust load
Impact of dust on diurnal cycle in OLR:comparison of HiGAM with GERB data for July (from Ruth Comer)
18yr mean dust load by size bin (1-6) for 4 exptsANN DJF MAM JJA SON
Easterly Waves • African Easterly waves – look at 700mb meridional wind component June to Sept at 12hrly intervals across Atlantic • Add 12hrly dust loading diagnostics for limited no. of years (4) in ‘active’ dust expt.
June-Sept time-longitude plot of V and dust load meaned between 15N-25N across Atlantic (Model Yr 1998)
AEW and TC statistics • Results from Kevin Hodges’ storm tracking software indicate that easterly wave activity increases when dust rad FX are included (in both expt pairs, attributable to increased wind shear around the AEJ) • BUT TC activity differs, increasing in first pair and decreasing in second pair when dust FX included.
Dust expts performed with HiGAM • Atmos component of HiGEM driven by AMIP2 SSTs in paired expts, both including dust aerosol. • One is advanced using direct radiative effect of dust (‘active’ dust) • Other is advanced ignoring radiative effect of dust (‘passive’ dust) but values are calculated and output to estimate radiative forcing. • Two experiment pairs have been run, first pair 1981-2001 (20yrs), second pair 1983-2000 (18yrs) starting from different initial fields. • 76 years in all (!), but 20+ years is standard for dust impact studies because interannual variability is so high (in models and in reality)
Diurnal cycle for Zouerate and Bodele 1-10 Feb (3hrly data)Tsurf, 925mb and 10m wind, Dust emissOLR, PMSL, cloud, dust load
Diurnal cycle for Zouerate and Bodele 21-30 July (3hrly data)Tsurf, 925mb and 10m wind, Dust emissOLR, PMSL, cloud, dust load
DIFFS in 850 mb storm density (upper) and strength (lower) xcdfr - xcdfg
DIFFS in 600mb storm density (upper) and strength (lower) xcdfr - xcdfg