Download
1 / 12
120 likes | 138 Vues
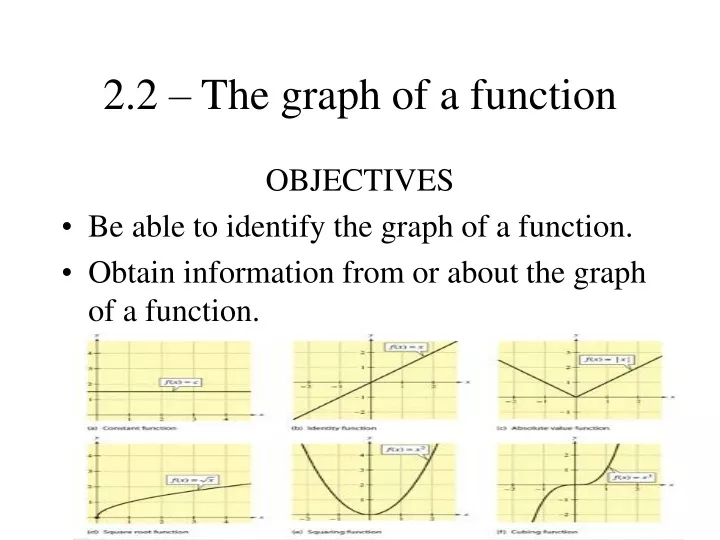
2.2 – The graph of a function. OBJECTIVES Be able to identify the graph of a function. Obtain information from or about the graph of a function. The Vertical Line Test.

E N D
2.2 – The graph of a function OBJECTIVES • Be able to identify the graph of a function. • Obtain information from or about the graph of a function.
The Vertical Line Test The set of points in the xy-plane is the graph of a function if and only if every vertical line intersects the graph in at most one point. The vertical line test is used to determine if a graph is a function.
If a vertical line passes through a graph more than once, the graph is not the graph of a function. Hint: Pass a pencil across the graph held vertically to represent a vertical line. The pencil crosses the graph more than once. This is not a function because there are two y-values for the same x-value.
Things that make you go hmmm……? • Can a function have more than one y-intercept? • Does the graph of a function y= f(x) always cross the y-axis? • If the graph of a function has a domain of all real numbers, what part of the graph is identified by f(0)?
Find f(2) and f(-5) • Is f(5) positive or negative? • For what numbers x if f(x) < 0? • What is the domain of f? • What is the range of f? • What are the x-intercepts? Y-intercept? • How often does the line y=1 intersect the graph? • For what values of x does f(x) = -2?
Average Cost Function • The average cost of manufacturing x computers per day is given by the function: • C(x) = .56x² - 34.39x +1212.57 + (20,000/x) • Determine the average cost of manufacturing: • 30 computers in a day • 40 computers in a day • 50 computers in a day • Graph the function C(x), 0 < x ≤ 80 • Create a TABLE with TblStart = 1 and ΔTbl = 1. Which value of x minimizes the avg cost?