Download

1 / 34
340 likes | 348 Vues
INFRASTRUCTURE. Fault Detection at Scale. Production Engineer, PE Network Monitoring. Giacomo Bagnoli . Monitoring the network How and what NetNORAD NFI TTLd Netsonar Lessons learned Future. Agenda. Network Monitoring . Fabric Networks. Multi stage CLOS topologies

E N D
INFRASTRUCTURE Fault Detection at Scale • Production Engineer, PE Network Monitoring • Giacomo Bagnoli
Monitoring the network • How and what • NetNORAD • NFI • TTLd • Netsonar • Lessons learned • Future • Agenda
Fabric Networks • Multi stage CLOS topologies • Lots of devices and links • BGP only • IPv6 >> IPv4 • Large ECMP fan out
Altoona, IA Forest City, NC Luleå, Sweden Clonee, Ireland Odense, Denmark Prineville, OR Papillion, NE Los Lunas, NM Fort Worth, TX
Why is passive not enough? • Active Network Monitoring • SNMP: trusting the network devices • Host TCP retransmits: packet loss is everywhere • Active network monitoring: • Inject synthetic packets in the network • Treat the devices as black boxes, see if they can forward traffic • Detect which service is impacted, triangulate loss to device/interface
NFI Isolate fault to a specific device or link NetNORAD Rapid detection of faults • What!? TTLd End-to-end retransmit and loss detection using production traffic Netsonar Up/Down reachability info
A set of agents injects synthetic UDP traffic • Targeting all machines in the fleet • targets >> agents • Responder is deployed on all machines • Collect packet loss and RTT • Report and analyze • NetNORAD Network
FRC CLN • NetNORAD - Target Selection FRC1 CLN1 DC P01 P01 P02 P02 GLOBAL REGION P02 P02 P01 P01 FRC2 CLN2
NetNORAD – Data Pipeline • Agents reports to a fleet of aggregators • pre-aggregated results data per target • Aggregators • calculate per-pod percentiles for loss/RTT • augment data with locality info • Reporting • to SCUBA • timeseries data • alarming Locality Alarming Timeseries SCUBA
Observability • By scope – isolates issue to • Backbone, region, dc Using SCUBA • By cluster/pod – isolates issue to • A small number of FSWs • By EBB/CBB • Is replication traffic affected? • By Tupperware Job • Is my service affected?
Gray Network failures • Detect and triangulate to device/link • Auto remediation • Also useful dashboards (timeseries and SCUBA) • Network Fault Isolation • NFI
Probe all paths by rotating the SRC port (ECMP) • Run traceroutes (also on reverse paths) • Associate loss with path info • Scheduling and data processing similar to NetNORAD • Thrift – based (TCP) • How (shortest version possible) • NFI
Blackbox monitoring tool • Sends ICMP probes to network switches • Provides reachability information: is it up or down? • Scheduling and data pipeline similar to NetNORAD and NFI • NetSONAR
Main goal: surface end to end retransmits throughout the network • Use production packets as probes • A mixed approach (not passive, not active) • End host mark one bit in the IP header when the packet is a retransmission • Uses MSB of TTL/Hop Limit • Marking is done by an eBPF program on end hosts • A collection framework collect stats from devices (sampled data) • Mixed Passive / Active approach • TTLd
Visualization • High density dashboards • Using cubism.js • Fancy javascript UIs • (various iterations) • Other experimental views
Example Fabric Layout SSW FSW RSW
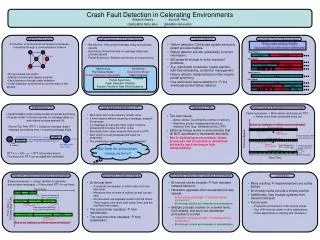
Clear signal in NetNORAD • Triangulated successfully by NFI • Also seen in passive collections • Bad FSW causing 25% loss in POD • Example 1
Low loss seen in NetNORAD • NFI drained the device • But the drain failed • NFI alarms again • Clear signal in TTLd too • Bad FSW could not be drained (failed automation) • Example 2
Congestion happens • NFI uses outlier detection • Not perfect • Loss in NetNORAD was just limited to a single DSCP • Congestion, false alarm • Example 3
Having multiple tools helps • Separate failure domains • Separation of concerns • But also adds a lot of overhead • Reliability: • Regressions are usually the biggest problem • Holes in coverage are the next big problem • Dependency / cascading failures • Multiple tools, similar problems • Lesson learned
After validating the proof of concept • How to make sure it continues working? • … that it can detect failures • … maintaining coverage • … and keeping up with scale • … and doesn’t fail with its dependencies? • i.e. how to know we can catch events reliably. • How to avoid regressions or holes?
It’s a function of time and space • e.g. we cover the 90% of the devices 99% of the time • Should not regress • New devices should be covered once provisioned • Monitor and alarm! • Coverage
Find a way to categorize events • Possibly automatically • Measure and keep history • Make sure there’s no regressions • false positive vs true positive • Accuracy
How do we know we can detect events? • Before we get an event, possibly! • End-to-End (E2E) testing: • Introduce fake faults and see if the tool can detect them • Usually done via ACL injection to block traffic • Middle-to-End (M2E) testing: • Introduce fake data in the aggregation pipeline • Useful for more complex failures • Not just for performances • Regression detection
Time to detection • Time to alarm • But also more classic metrics (cpu, mem, errors) • Measure and alarm! • Performance
Degrade gracefully during large scale events • i.e. what if SCUBA is down? • or the timeseries database? • “doomsday” tooling: • Review dependencies, see if you can drop as many as we can • Provide a subset of functionalities • Make sure it’s user friendly (both the UI and the help) • Make sure it’s continuously tested • Or how to survive when things start to fry • Dependencies failures
Keep up with scale • Support new devices and networks • Continue to provide a stable signal • Exploring ML for data analysis • Improve coverage • Lots of work to do • Future work