Download
1 / 17
180 likes | 191 Vues
Self-organizing map for cluster analysis of a breast cancer database. Mia K. Markey, Joseph Y. Lo, Georgia D. Tourassi, Carey E. Floyd Jr. Artificial Intelligence in Medicine 27 (2003) 113–127 Advisor : Professor Chung-Chian Hsu Reporter : Wen-Chung Liao 2006/5/17. Outline. Motivation

E N D
Self-organizing map for cluster analysis of a breast cancer database Mia K. Markey, Joseph Y. Lo, Georgia D. Tourassi, Carey E. Floyd Jr. Artificial Intelligence in Medicine 27 (2003) 113–127 Advisor : Professor Chung-Chian Hsu Reporter : Wen-Chung Liao 2006/5/17
Outline • Motivation • Objectives • Data • Methods • Results • Discussion • Comments
Motivation • The decision to biopsy is complicated • breast cancer can present itself in a variety of ways on a mammogram • considerable overlap in the appearance of benign and malignant lesions. • Unsupervised learning may provide an alternate avenue to a priori knowledge for identifying subsets in the data that should be handled separately in the development or evaluation of computer-aided diagnosis or detection systems.
Objectives • The purpose of this study was to identify and characterize clusters in a heterogeneous breast cancer computer-aided diagnosis database. • Identification of subgroups within the database could help elucidate clinical trends and facilitate future model building.
Data • available data:4435 • model development: 2258 (982 malignant) • 751 suspicious breast lesions at Duke Univ. Med. Center • mammographers described each case using BI-RADS lexicon • each of the cases was read by one of seven readers :six BI-RADS features and the patient age. • 260 (35%) were malignant. • 501 from Univ. of Penn. Med. Center, 200 (40%) were malignant. • 1006 lesions randomly selected from the Digital Database for Screening Mammography, 522(52%) were malignant. • model validation: 2177 • The overall malignancy fraction was 43%.
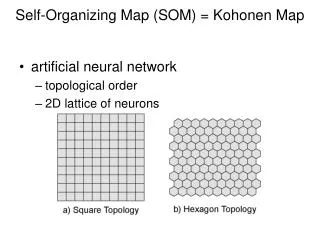
Methods • Self-organizing map • using the SOM toolbox in MATLAB • 2-D grid of 4 x 4 neurons, but different configurations were considered. • Features standardization • seven input features,the biopsy outcome was not provided to the SOM • Constraint satisfaction neural network (CSNN) • determine the profiles of the clusters • 1000 iterations, weights determined by auto-BP • Each category of BI-RADS features corresponded to a binary variable and associated neuron. • the mass margin with its five non-zero categories : five separate neurons • Patient age : five levels (<40, 40≦x< 50, 50≦x<60, 60≦x<70, 70≦)
Error Methods • Back-propagation artificial neural network (BP-ANN) • predict the biopsy outcome from the mammographic findings and patient age. • Single hidden layer of 14 neurons • Logistic activation function • Input: 6 BI-RADS features and age • One output node to indicate malignancy • ROC curves • show the trade-off in sensitivity and specificity achievable by a classifier by varying the threshold on the output decision variable • sensitivity=t_pos/pos, • specificity=t_neg/neg • The area under the ROC curve is often used as a measure of classifier performance. • Only techniques with high sensitivity would be acceptable. 98% sensitivity.
Rf: Fawcett(2006). An introduction to ROC analysis. Pattern Recognition Letters 27. ROC
Results Fig. 2 Fig. 3(d)
Results • BP-ANN predict the biopsy outcome • The SOM can do a malignancy prediction • For example, if a case belonged to cluster #4, then the classifier output for that case would be 0.83. • Fig. 6 shows the ROC curve for the BP-ANN and SOM. • The performance at the highest sensitivities was comparable. • In particular, at 98% sensitivity • the SOM operates with 0.26±0.03 specificity • the BP-ANN operates with 0.25±0.03 specificity (P=0.93).
Results • Fig. 7 lists the BP-ANN’s recommendations for follow up instead of biopsy on the subsets identified by the SOM (320 cases) • A threshold was applied to the BP-ANN outputs such that • sensitivity = 98% (965/982) • specificity = 24% (303/1276). • In other words, 320 cases (303 actual negatives and 17 actual positives) fell below the threshold. • The majority of the benign lesions that the BP-ANN would have spared biopsy (242/303=80%) were in the cluster defined by neuron #6. Fig. 7 True Positive False Negative 965 17 971 303 False Positive True Negative
Results • A classification rule based on the cluster profiles (Figs. 4 and 5) of neuron #6 and a classification and regression tree (CART) • The classification rule was: • if the mass margin was well-circumscribed or obscured and the age was less than 59 years and there were no calcifications, associated findings, or special findings, then do not biopsy, otherwise do biopsy.
Results • On the 2258 training cases, • this rule gave 961/982=98% sensitivity and 336/1276=26% specificity. • this rule performed comparably to the BP-ANN with a threshold of 0.1842 (965/982=98% sensitivity, 303/1276=24% specificity). • On the validation set, • the classification rule gave 886/904=98% sensitivity and 339/1273=27% specificity • the BP-ANN with a threshold of 0.1842 gave 884/904=98% sensitivity and 296/1273=23% specificity. • Thus, both the BP-ANN and the rule-based approach generalized and they performed comparably at this high sensitivity point.
Discussion • Considerable variability from cluster to cluster. • One of the major goals of computer-aided diagnosis of breast cancer is • to identify very likely benign cases, in order to reduce the number of benign biopsies. • It is possible to use the clusters and their malignancy fractions directly as a tool for predicting biopsy outcome. • The SOM prediction method, similar to a case-based reasoning system. • the SOMs with similar architectures showed substantial agreement in clustering the data.
Discussion • The SOM prediction method in conjunction with the CSNN profiling method has the potential advantage • physicians may understand the intuition • the BP-ANN, which is often seen as a ‘‘black box’’. • The successful separation of a priori known, coarse lesion types (masses, clustered microcalcifications, focal asymmetric densities, and architectural distortions) provided some quality assurance of the clustering.
Discussion • Classification based on the SOM was competitive to that achieved by the BP-ANN at high sensitivity levels (Fig. 6). • the SOM clustering and CSNN profiling technique could be used to provide the physician with an alternative description of what the BP-ANN does for certain types of cases. • The identification of a single cluster that accounted for the majority of the cases that the BP-ANN would have recommended for follow up also suggests the investigation of rule-based methods to identify relatively simple diagnostic criteria which might be applied to these cases to aid the radiologists in their decision making process. • Based on the profiles of the clusters (#6) identified by the SOM, a simple classification rule was developed and performed comparably to the BPANN
Comments • Advantage: • Divide and conquer approach • A good classification rule • A good example of knowledge discovery • Disadvantage • high false positive rate: 971/1276=0.76 • Low accuracy: (965+303)/2258=0.56 • Solution: Remove cluster #6, then repeat the divide and conquer approach? • Such a research depends on domain knowledge heavily.