Download
1 / 1
10 likes | 76 Vues
Quantitative measurement of neuro-degeneration in an ALS–PDC mouse model using MR microscopy.

E N D
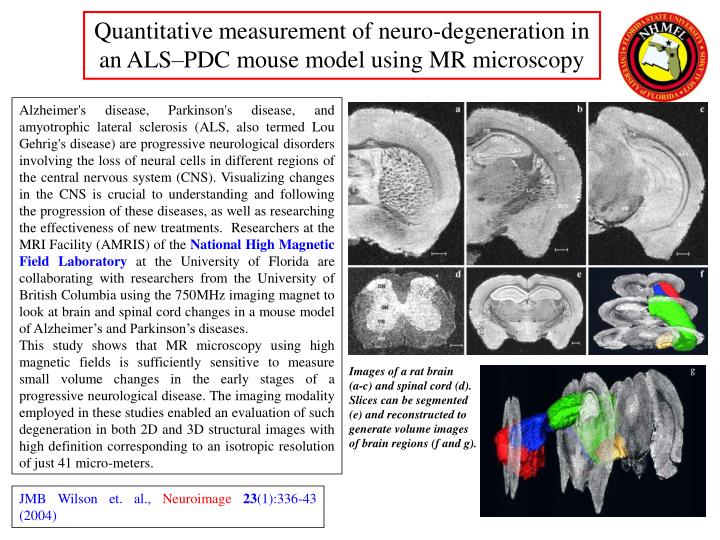
Quantitative measurement of neuro-degeneration in an ALS–PDC mouse model using MR microscopy Alzheimer's disease, Parkinson's disease, and amyotrophic lateral sclerosis (ALS, also termed Lou Gehrig's disease) are progressive neurological disorders involving the loss of neural cells in different regions of the central nervous system (CNS). Visualizing changes in the CNS is crucial to understanding and following the progression of these diseases, as well as researching the effectiveness of new treatments. Researchers at the MRI Facility (AMRIS) of the National High Magnetic Field Laboratory at the University of Florida are collaborating with researchers from the University of British Columbia using the 750MHz imaging magnet to look at brain and spinal cord changes in a mouse model of Alzheimer’s and Parkinson’s diseases. This study shows that MR microscopy using high magnetic fields is sufficiently sensitive to measure small volume changes in the early stages of a progressive neurological disease. The imaging modality employed in these studies enabled an evaluation of such degeneration in both 2D and 3D structural images with high definition corresponding to an isotropic resolution of just 41 micro-meters. Images of a rat brain (a-c) and spinal cord (d). Slices can be segmented (e) and reconstructed to generate volume images of brain regions (f and g). g JMB Wilson et. al., Neuroimage23(1):336-43 (2004)