Download
1 / 1
10 likes | 135 Vues
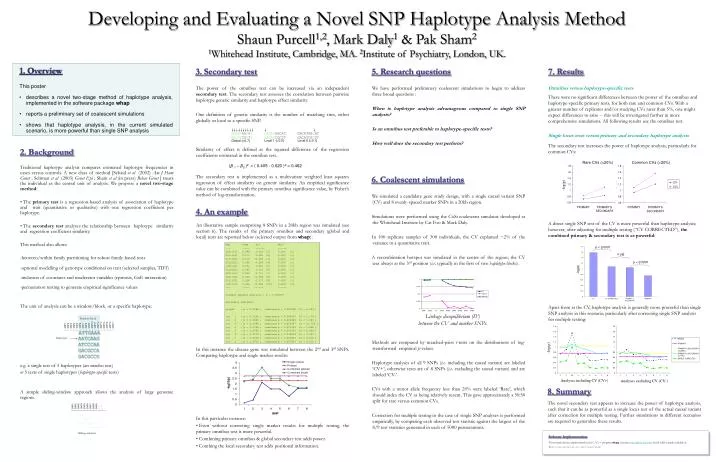
p < 0.0001. n.sig. p < 0.0001. -log(p). SNP4. SNP3. SNP8. SNP9. SNP1. SNP2. SNP5. SNP6. SNP7. . . Sliding windows. Rare CVs (<20%). Common CVs (>20%). -log(p). -log(p). Window/block. SNP10. SNP14. SNP15. SNP11. SNP12. SNP13. SNP16. SNP17. SNP4. SNP9. SNP1. SNP2.

E N D
p < 0.0001 n.sig. p < 0.0001 -log(p) SNP4 SNP3 SNP8 SNP9 SNP1 SNP2 SNP5 SNP6 SNP7 ....... ....... Sliding windows Rare CVs (<20%) Common CVs (>20%) -log(p) -log(p) Window/block SNP10 SNP14 SNP15 SNP11 SNP12 SNP13 SNP16 SNP17 SNP4 SNP9 SNP1 SNP2 SNP3 SNP5 SNP6 SNP7 SNP8 ATTGAAA AATCAAG ATCCCAA GACGCCA GACGCCG Haplotype Analyses including CV (CV+) Analyses excluding CV (CV-) Linkage disequilibrium (D’) between the CV and marker SNPs. GACATAACAT GACATCGCTT GACATAACAT GACATCGCTT GACATAACAT GACATCGCTT Local 8 (=0.1) Local 1 (=0.5) Global (=0.7) Software Implementation These methods are implemented in the C/C++ program whap (contact purcell@wi.mit.edu) which will be made available at http://www.genome.wi.mit.edu/~shaun/whap/ Developing and Evaluating a Novel SNP Haplotype Analysis MethodShaun Purcell1,2, Mark Daly1 & Pak Sham21Whitehead Institute, Cambridge, MA. 2Institute of Psychiatry, London, UK. 1. Overview This poster • describes a novel two-stage method of haplotype analysis, implemented in the software package whap • reports a preliminary set of coalescent simulations • shows that haplotype analysis, in the current simulated scenario, is more powerful than single SNP analysis 3. Secondary test The power of the omnibus test can be increased via an independent secondary test. The secondary test assesses the correlation between pairwise haplotype genetic similarity and haplotype effect similarity. One definition of genetic similarity is the number of matching sites, either globally or local to a specific SNP. Similarity of effect is defined as the squared difference of the regression coefficients estimated in the omnibus test. The secondary test is implemented as a multivariate weighted least squares regression of effect similarity on genetic similarity. An empirical significance value can be combined with the primary omnibus significance value, by Fisher’s method of log-transformation. 5. Research questions We have performed preliminary coalescent simulations to begin to address three broad questions : When is haplotype analysis advantageous compared to single SNP analysis? Is an omnibus test preferable to haplotype-specific tests? How well does the secondary test perform? 7. Results Omnibus versus haplotype-specific tests There were no significant differences between the power of the omnibus and haplotype-specific primary tests, for both rare and common CVs. With a greater number of replicates and/or studying CVs rarer than 5%, one might expect differences to arise -- this will be investigated further in more comprehensive simulations. All following results use the omnibus test. Single locus tests versus primary and secondary haplotype analysis The secondary test increases the power of haplotype analysis, particularly for common CVs: A direct single SNP test of the CV is more powerful than haplotype analysis; however, after adjusting for multiple testing (“CV CORRECTED”), the combined primary & secondary test is as powerful: Apart from at the CV, haplotype analysis is generally more powerful than single SNP analysis in this scenario, particularly after correcting single SNP analysis for multiple testing: 2. Background Traditional haplotype analysis compares estimated haplotype frequencies in cases versus controls. A new class of method [Schaid et al (2002) Am J Hum Genet ;Seltman et al (2003) Genet Epi ; Sham et al (in press) Behav Genet ] treats the individual as the central unit of analysis. We propose a novel two-stage method: • The primary test is a regression-based analysis of association of haplotype and trait (quantitative or qualitative) with one regression coefficient per haplotype. • The secondary test analyses the relationship between haplotype similarity and regression coefficient similarity. This method also allows • between/within family partitioning for robust family-based tests • optional modelling of genotype conditional on trait (selected samples, TDT) • inclusion of covariates and moderator variables (epistasis, GxE interaction) • permutation testing to generate empirical significance values The unit of analysis can be a window/block, or a specific haplotype: e.g. a single test of 5 haplotypes (an omnibus test) or 5 tests of single haplotypes (haplotype-specific tests) A simple sliding-window approach allows the analysis of large genomic regions. (β1 – β2 )2 = ( 0.405 - 0.620 )2 = 0.462 6. Coalescent simulations We simulated a candidate gene study design, with a single causal variant SNP (CV) and 8 evenly-spaced marker SNPs in a 20kb region. Simulations were performed using the CoSi coalescent simulator developed at the Whitehead Institute by Cat Foo & Mark Daly. In 100 replicate samples of 300 individuals, the CV explained ~2% of the variance in a quantitative trait. A recombination hotspot was simulated in the center of the region; the CV was always at the 3rd position (i.e. typically in the first of two haplotype blocks). Methods are compared by matched-pairs t-tests on the distributions of log-transformed empirical p-values. Haplotype analyses of all 9 SNPs (i.e. including the causal variant) are labeled ‘CV+’; otherwise tests are of 8 SNPs (i.e. excluding the causal variant) and are labeled ‘CV-’. CVs with a minor allele frequency less than 20% were labeled ‘Rare’, which should index the CV as being relatively recent. This gave approximately a 50:50 split for rare versus common CVs. Correction for multiple testing in the case of single SNP analyses is performed empirically, by comparing each observed test statistic against the largest of the 8/9 test statistics generated in each of 5000 permutations. 4. An example An illustrative sample comprising 8 SNPs in a 20kb region was simulated (see section 6). The results of the primary omnibus and secondary (global and local) tests are reported below (selected output from whap): In this instance the disease gene was simulated between the 2nd and 3rd SNPs. Comparing haplotype and single marker results: In this particular instance: • Even without correcting single marker results for multiple testing, the primary omnibus test is more powerful. • Combining primary omnibus & global secondary test adds power. • Combing the local secondary test adds positional information. Hap Freq Alt Null --- ----- ------ ------ 22211121 0.396 0.000 [1] 0.000 [1] 22111121 0.173 0.090 [2] 0.000 [1] 21211221 0.110 -0.045 [3] 0.000 [1] 22122212 0.095 0.289 [4] 0.000 [1] 12211221 0.071 0.261 [5] 0.000 [1] 21222212 0.040 0.053 [6] 0.000 [1] 22111212 0.035 0.711 [7] 0.000 [1] 22211221 0.030 -0.294 [8] 0.000 [1] 22111221 0.026 0.373 [9] 0.000 [1] 12211212 0.024 -0.604 [10] 0.000 [1] --- ----- ------ ------ Primary omnibus analysis : p = 0.004975 Secondary analyses: global : p = 0.0398 ; combined p = 0.001886 (S = 8.083 ) loc 1 : p = 0.1542 ; combined p = 0.006270 (S = 2.174 ) loc 2 : p = 0.0895 ; combined p = 0.003883 (S = 3.687 ) loc 3 : p = 0.0049 ; combined p = 0.000287 (S = 21.725 ) loc 4 : p = 0.0746 ; combined p = 0.003303 (S = 2.928 ) loc 5 : p = 0.0746 ; combined p = 0.003303 (S = 2.928 ) loc 6 : p = 0.4179 ; combined p = 0.014919 (S = 0.297 ) loc 7 : p = 0.8706 ; combined p = 0.027903 (S = 0.010 ) loc 8 : p = 0.8706 ; combined p = 0.027903 (S = 0.010 ) 8. Summary The novel secondary test appears to increase the power of haplotype analysis, such that it can be aspowerful as a single locus test of the actual causal variant after correction for multiple testing. Further simulations in different scenarios are required to generalize these results.