Download
1 / 1
10 likes | 93 Vues
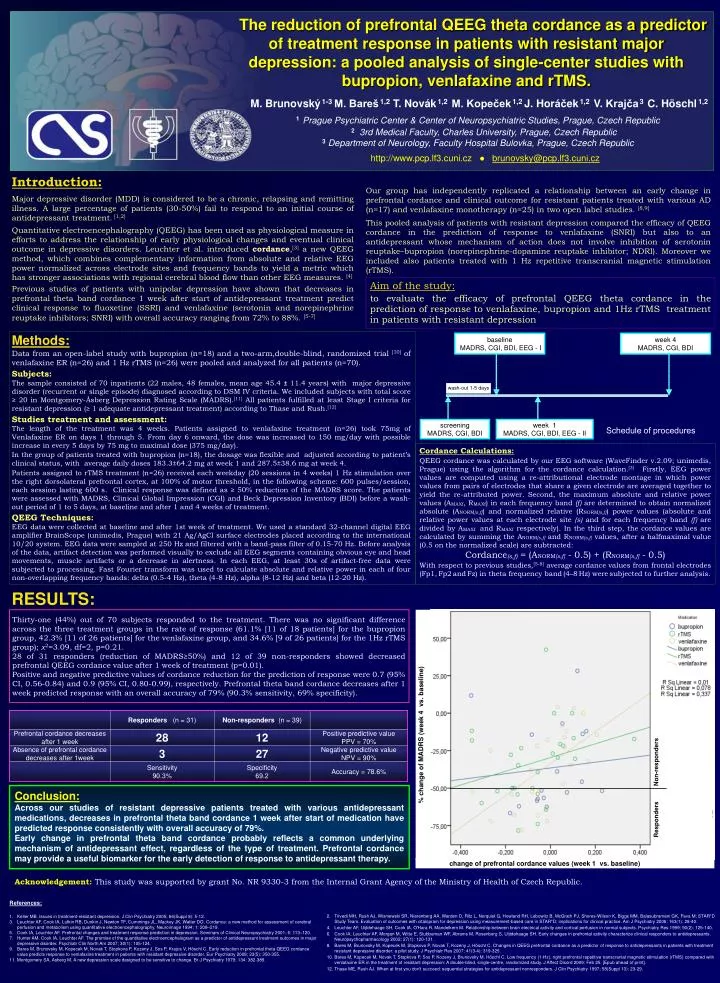
% change of MADRS (week 4 vs. baseline). Responders Non-responders. change of prefrontal cordance values (week 1 vs. baseline).

E N D
% change of MADRS (week 4 vs. baseline) Responders Non-responders change of prefrontal cordance values (week 1 vs. baseline) The reduction of prefrontal QEEG theta cordance as a predictor of treatment response in patients with resistant major depression: a pooled analysis of single-center studies with bupropion, venlafaxine and rTMS. M. Brunovský1-3M. Bareš1,2T. Novák1,2 M. Kopeček1,2J. Horáček1,2 V. Krajča3C. Höschl1,2 1 Prague Psychiatric Center & Center of Neuropsychiatric Studies, Prague, Czech Republic 2 3rd Medical Faculty, Charles University, Prague, Czech Republic 3Department of Neurology, Faculty Hospital Bulovka, Prague, Czech Republic http://www.pcp.lf3.cuni.cz ● brunovsky@pcp.lf3.cuni.cz Introduction: Major depressive disorder (MDD) is considered to be a chronic, relapsing and remitting illness. A large percentage of patients (30-50%) fail to respond to an initial course of antidepressant treatment. [1,2] Quantitative electroencephalography (QEEG) has been used as physiological measure in efforts to address the relationship of early physiological changes and eventual clinical outcome in depressive disorders. Leuchter et al. introduced cordance,[3] a new QEEG method, which combines complementary information from absolute and relative EEG power normalized across electrode sites and frequency bands to yield a metric which has stronger associations with regional cerebral blood flow than other EEG measures. [4] Previous studies of patients with unipolar depression have shown that decreases in prefrontal theta band cordance 1 week after start of antidepressant treatment predict clinical response to fluoxetine (SSRI) and venlafaxine (serotonin and norepinephrine reuptake inhibitors; SNRI) with overall accuracy ranging from 72% to 88%. [5-7] Our group has independently replicated a relationship between an early change in prefrontal cordance and clinical outcome for resistant patients treated with various AD (n=17) and venlafaxine monotherapy (n=25) in two open label studies. [8,9] This pooled analysis of patients with resistant depression compared the efficacy of QEEG cordance in the prediction of response to venlafaxine (SNRI) but also to an antidepressant whose mechanism of action does not involve inhibition of serotonin reuptake–bupropion (norepinephrine-dopamine reuptake inhibitor; NDRI). Moreover we included also patients treated with 1 Hz repetitive transcranial magnetic stimulation (rTMS). Aim of the study: to evaluate the efficacy of prefrontal QEEG theta cordance in the prediction of response to venlafaxine, bupropion and 1Hz rTMS treatment in patients with resistant depression Methods: Data from an open-label study with bupropion (n=18) and a two-arm,double-blind, randomized trial[10] of venlafaxine ER (n=26) and 1 Hz rTMS (n=26) were pooled and analyzed for all patients (n=70). Subjects: The sample consisted of 70 inpatients (22 males, 48 females, mean age 45.4 ± 11.4 years) with major depressive disorder (recurrent or single episode) diagnosed according to DSM IV criteria. We included subjects with total score ≥20 in Montgomery-Åsberg Depression Rating Scale (MADRS).[11] All patients fulfilled at least Stage I criteria for resistant depression (≥1 adequate antidepressant treatment) according to Thase and Rush.[12] Studies treatment and assessment: The length of the treatment was 4 weeks. Patients assigned to venlafaxine treatment (n=26) took 75mg of Venlafaxine ER on days 1 through 5. From day 6 onward, the dose was increased to 150 mg/day with possible increase in every 5 days by 75 mg to maximal dose (375 mg/day). In the group of patients treated with bupropion (n=18), the dosage was flexible and adjusted according to patient’s clinical status, with average daily doses 183.3±64.2 mg at week 1 and 287.5±38.6 mg at week 4. Patients assigned to rTMS treatment (n=26) received each weekday (20 sessions in 4 weeks) 1 Hz stimulationover the right dorsolateral prefrontal cortex, at 100% of motor threshold, in the following scheme: 600 pulses/session, each sessionlasting 600 s.Clinical response was defined as ≥50% reduction of the MADRS score. The patients were assessed with MADRS, Clinical Global Impression (CGI) and Beck Depression Inventory (BDI) before a wash-out period of 1 to 5 days, at baseline and after 1 and 4 weeks of treatment. QEEG Techniques: EEG data were collected at baseline and after 1st week of treatment. We used a standard 32-channel digital EEG amplifier BrainScope (unimedis, Prague) with 21 Ag/AgCl surface electrodes placed according to the international 10/20 system. EEG data were sampled at 250 Hz and filtered with a band-pass filter of 0.15-70 Hz.Before analysis of the data, artifact detection was performed visually to exclude all EEG segments containing obvious eye and head movements, muscle artifacts or a decrease in alertness.In each EEG, at least 30s of artifact-free data were subjected to processing. Fast Fourier transform was used to calculate absolute and relative power in each of four non-overlapping frequency bands:delta(0.5-4 Hz), theta(4-8 Hz), alpha(8-12 Hz) and beta(12-20 Hz). baseline MADRS, CGI, BDI, EEG - I week 4 MADRS, CGI, BDI wash-out 1-5 days screening MADRS, CGI, BDI week 1 MADRS, CGI, BDI, EEG - II Schedule of procedures Cordance Calculations: QEEG cordance was calculated by our EEG software (WaveFinder v.2.09; unimedis, Prague) using the algorithm for the cordance calculation.[3]Firstly, EEG power values are computed using a re-attributional electrode montage in which power values from pairs of electrodesthat share a given electrode are averaged togetherto yield the re-attributed power. Second, the maximum absolute and relative power values (AMAXf, RMAXf) in each frequency band (f) are determined to obtain normalized absolute (ANORM[s,f]) and normalized relative (RNORM[s,f]) power values (absolute and relative power values at each electrode site (s) and for each frequency band (f) are divided by AMAXf and RMAXf respectively). In the third step, the cordance values are calculated by summing the ANORM[s,f] and RNORM[s,f] values, after a halfmaximal value (0.5 on the normalized scale) are subtracted: Cordance(s,f)= (ANORM[s,f] - 0.5)+ (RNORM[s,f] - 0.5) With respect to previous studies,[5-8] average cordance values from frontal electrodes (Fp1,Fp2andFz) in theta frequency band(4–8Hz) weresubjected to further analysis. RESULTS: Thirty-one (44%) out of 70 subjects responded to the treatment.There was no significant difference across the three treatment groups in the rate of response (61.1% [11 of 18 patients] for the bupropion group, 42.3% [11 of 26 patients] for the venlafaxine group, and 34.6% [9 of 26 patients] for the 1Hz rTMS group); χ2=3.09, df=2, p=0.21. 28 of 31 responders (reduction of MADRS≥50%) and 12 of 39 non-responders showed decreased prefrontal QEEG cordance value after 1 week of treatment (p=0.01). Positive and negative predictive values of cordance reduction for the prediction of response were 0.7 (95% CI, 0.56-0.84) and 0.9 (95% CI, 0.80-0.99), respectively. Prefrontal theta band cordance decreases after 1 week predicted response with an overall accuracy of 79% (90.3% sensitivity, 69% specificity). Conclusion: Across our studies of resistant depressive patients treated with various antidepressant medications, decreases in prefrontal theta band cordance 1 week after start of medication have predicted response consistently with overall accuracy of 79%. Early change in prefrontal theta band cordance probably reflects a common underlying mechanism of antidepressant effect, regardless of the type of treatment. Prefrontal cordance may provide a useful biomarker for the early detection of response to antidepressant therapy. Acknowledgement:This study was supported by grant No. NR 9330-3 from the Internal Grant Agency of the Ministry of Health of Czech Republic. • References: • Keller MB. Issues in treatment-resistant depression. J Clin Psychiatry 2005;66(Suppl 8):5-12. • Leuchter AF, Cook IA, Lufkin RB, Dunkin J, Newton TF, Cummings JL, Mackey JK, Walter DO. Cordance: a new method for assessment of cerebral perfusion and metabolism using quantitative electroencephalography. Neuroimage 1994;1:208–219. • Cook IA, Leuchter AF. Prefrontal changes and treatment response prediction in depression. Seminars of Clinical Neuropsychiatry 2001;6:113–120. • Hunter AM, Cook IA, Leuchter AF. The promise of the quantitative electroencephalogram as a predictor of antidepressant treatment outcomes in major depressive disorder. Psychiatr Clin North Am 2007; 30(1):105-124. • Bares M, Brunovsky M, Kopecek M, Novak T, Stopkova P, Kozeny J, Sos P, KrajcaV, Höschl C. Early reduction in prefrontal theta QEEG cordance value predicts response tovenlafaxine treatment in patients with resistant depressive disorder.Eur Psychiatry 2008;23(5):350-355. • Montgomery SA, Asberg M. A new depression scale designed to be sensitive to change. Br J Psychiatry 1979;134:382-389. • Trivedi MH, Rush AJ, Wisniewski SR, Nierenberg AA, Warden D, Ritz L, Norquist G, Howland RH, Lebowitz B, McGrath PJ, Shores-Wilson K, Biggs MM,BalasubramaniGK, Fava M; STAR*D Study Team. Evaluation of outcomes with citalopram fordepression using measurement-based care in STAR*D: implications for clinicalpractice. Am J Psychiatry 2006;163(1):28-40. • Leuchter AF, Uijtdehaage SH, Cook IA, O'Hara R, Mandelkern M. Relationshipbetween brain electrical activity and cortical perfusion in normal subjects.Psychiatry Res1999;90(2):125-140. • Cook IA, Leuchter AF, Morgan M, Witte E, Stubbeman WF, Abrams M, Rosenberg S,Uijtdehaage SH. Early changes in prefrontal activity characterize clinicalresponders to antidepressants. Neuropsychopharmacology 2002;27(1):120-131. • Bares M, Brunovsky M, Kopecek M, Stopkova P, Novak T, Kozeny J, Höschl C. Changes in QEEG prefrontal cordance as a predictor of response to antidepressantsin patients with treatment resistant depressive disorder: a pilot study.J Psychiatr Res 2007;41(3-4):319-325. • Bares M, Kopecek M, Novak T, Stopkova P, Sos P, Kozeny J, Brunovsky M, Höschl C. Low frequency (1-Hz), right prefrontal repetitive transcranial magnetic stimulation (rTMS) compared with venlafaxine ER in the treatment of resistant depression: A double-blind, single-centre, randomized study. J Affect Disord 2009; Feb 25. [Epub ahead of print]. • Thase ME, Rush AJ. When at first you don't succeed: sequential strategies for antidepressant nonresponders. J Clin Psychiatry 1997;58(Suppl 13):23-29.