Download
1 / 79
790 likes | 866 Vues
Social Stratification. A system by which a society ranks categories of people in a hierarchy. Basic Principles. A trait of society Doesn’t reflect individual differences, but society’s structure Persists over generations Social mobility happens slowly. Universal but variable

E N D
Social Stratification A system by which a society ranks categories of people in a hierarchy
Basic Principles • A trait of society • Doesn’t reflect individual differences, but society’s structure • Persists over generations • Social mobility happens slowly. • Universal but variable • While universal, it varies in type. • Involves not just inequality, but beliefs • Ideologies justify existence of social stratification.
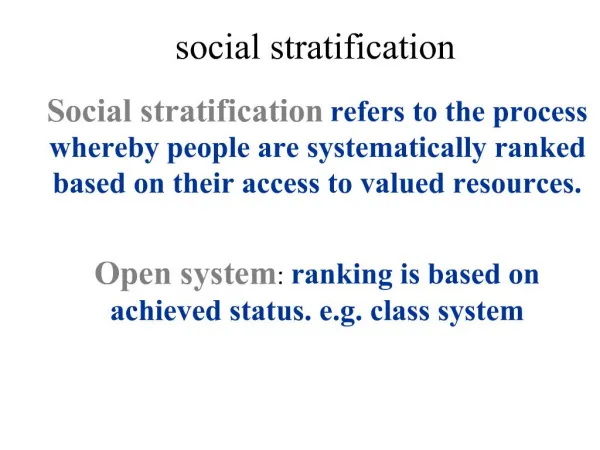
The Caste System • Birth determines social position in four ways: • Occupation • Marriage within caste • Social life is restricted to “own kind.” • Belief systems are often tied to religious dogma. • Many of the world’s societies are caste systems. • Caste system is illegal, but elements survive. Social stratification based on ascription, or birth
Class Systems • Social mobility for people with education and skills • All people gain equal standing before the law. • Work involves some personal choice. • Meritocracy: Based on personal merit Social stratification based on both birth and individual achievement
Class Systems • Status consistency–The degree of uniformity in a person's social standing across various dimensions of social inequality. • A caste system has limited social mobility and high status consistency. • The greater mobility of class systems produces less status consistency.
Ideology • Plato • Every culture considers some type of inequality just. • Marx • Capitalist societies keep wealth and power for a few. • Spencer • “Survival of the fittest” Cultural beliefs that justify particular social arrangements, including patterns of inequality
The Davis-Moore Thesis • The greater the importance of a position, the more rewards a society attaches to it. • Egalitarian societies offer little incentive for people to try their best. • Positions a society considers more important must reward enough to draw talented people Social stratification has beneficial consequences for the operation of a society
Karl Marx: Class and Conflict • Most people have one of two relationships with the means of production. • Bourgeoisie own productive property. • The proletariat works for the bourgeoisie. • Capitalism creates great inequality in power and wealth. • This oppression would drive the working majority to organize and overthrow capitalism.
Why No Marxist Revolution? • Fragmentation of the capitalist class • Higher standard of living • More worker organizations • More extensive legal protections
Was Marx Right? • Wealth remains highly concentrated. • White-collar jobs offer no more income, security, or satisfaction than factory work did a century ago.
Was Marx Right? • Current workers’ benefits came from struggle. • Workers have lost benefits recently. • Ordinary people still face disadvantages that the law cannot overcome.
Max Weber: Class, Status, and Power • Socioeconomic status (SES) • Composite ranking based on various dimensions of social inequality • Class position • Viewed classes as a continuum from high to low • Status • Power • Inequality in history
Stratification and Interaction • Differences in social class position can affect interaction. • People interact primarily with others of similar social standing. • Conspicuous consumption refers to buying and using products because of the "statement" they make about social position.
Stratification and Technology: A Global Perspective • Hunting and gathering societies • Horticultural, pastoral, and agrarian societies • Industrial societies • The Kuznets curve • Greater technological sophistication generally is accompanied by more pronounced social stratification.
Figure 10.2 Social Stratification and Technological Development: The Kuznets CurveThe Kuznets curve shows that greater technological sophistication is generally accompanied by more pronounced social stratification. The trend reverses itself as industrial societies relax rigid, castelike distinctions in favor of greater opportunity and equality under the law. Political rights are more widely extended, and there is even some leveling of economic differences. However, the emergence of postindustrial society has brought an upturn in economic inequality, as indicated by the broken line added by the author.Source: Created by the author, based on Kuznets (1955) and Lenski (1966).
Social Stratification • Vonnegut: An egalitarian society can exist only if everyone is reduced to the lowest common denominator. • Davis-Moore thesis: Class differences reflect variation in human abilities and the relative importance of different jobs. • Marx: Inequality causes human suffering and conflict; social stratification springs from injustice and greed.
A Middle-Class Society • Everyone stands equal under the law. • We celebrate individuality. • We interact mostly with people like ourselves. • The US is an affluent society. • Socioeconomic status (SES) reflects money (income, wealth & power), occupational prestige and schooling.
Figure 11.1 Distribution of Income and Wealth in the United StatesIncome, and especially wealth, is divided unequally in US Society.Sources: Income data from U.S. Census Bureau (2006); wealth data based on Keister (2000), Wolff (2004), Bucks, Kennickell, & Moore (2006), and author estimates.
Dimensions of Class • Income • Earning from work or investments • Wealth • The total value of money and other assets, minus any debt • Power • The ability to control, even in the face of resistance • Occupational prestige • Job-related status • Schooling • Key to better career opportunities
Table 11.2a The Relative Social Prestige of Selected Occupations in the United States(Continued on next slide)
US Stratification: Merit and Caste • Ancestry • Born to privilege or poverty makes a big difference • Race and ethnicity • Disparity still exists when comparing majority and minority groups on social and financial variables. • People of English ancestry have always enjoyed the most wealth and the greatest power in US society. • Gender • More poor families are headed by women. • On average, women have less income, wealth, and occupational prestige than men.
Table 11.3 Schooling of U.S. Adults, 2006 (aged 25 and over)
Social Classes • The upper class • 5% of the population • Earn at least $185,000 a year • The middle class • 40-45% of the population • Large middle class has tremendous cultural influence. • The working class • 33% of the population • Blue-collar jobs yield between $25,000 and $45,000 a year. • The lower class • The remaining 20% of the population • Working poor hold low-prestige jobs that provide little income.
Upper Class • The upper-uppers • The “blue bloods” • Membership almost always based on ascription • “Old money” • Set apart by the amount of wealth their families control • Devote time to community activities • The lower-uppers • The working rich • The “new rich” • Can still be excluded from some organizations
Middle Class • More racial and ethnic diversity • Upper-middles • $80,000 to $170,000 yearly income • Education is important • High occupational prestige • Involvement in local politics • Average-middles • Less occupational prestige • Few white collar or high-skilled blue collar jobs • Income provides modest security
Working Class • Lower-middle class • Marxist “industrial proletariat” • $25,000 to $40,000 annual income • Routine jobs with less satisfaction • Half own their own homes • Fewer children go to college • Vulnerable to financial problems caused by unemployment or illness
Lower Class • 37 million Americans classified as poor in 2005 • Others are “working poor” with minimum-wage jobs • Half complete high school, one in four attend college • Own homes in less desirable urban neighborhoods or rural south
National Map 11.1 Per Capita Income across the United States, 2003
The Difference Class Makes • Health • Amount and type of health care • Values and attitudes • Vary with position • Politics • Conservative or liberal • Family and gender • Type of parental involvement • Socialization practices • Relationships and responsibilities
Social Mobility • Upward • College degree or higher-paying job • Downward • Drop out of school, losing a job or divorce • Structural social mobility • Changes in society or national economic trends • Intra-generational mobility • Change in social position during a person’s lifetime • Intergenerational mobility • Upward or downward movement that takes place across generations within a family
Myth vs. Reality • Social mobility has been fairly high. • Long-term trend has been upward. • Intergenerational mobility is small, not dramatic. • Social mobility since the 1970s has been uneven.
Figure 11.2 Mean Annual Income, US Families, 1980-2005 (in 2005 dollars, adjusted for inflation)The gap between high-income and low-income families is wider today than it was in 1980.Source: U.S. Census Bureau (2006).
The American Dream • Earnings have stalled for many workers • From 1974-2004, worker income rose slightly, even as the number of work hours increased and cost of necessities went way up. • More jobs offer little income • Many industrial jobs have gone overseas, reducing the number of high-paying US jobs. • Young people are remaining at (and returning) home • For the first time ever, half of Americans age 18 to 24 are living with their parents.
Figure 11.3Median Annual Income, US Families, 1950-2005Average family income in the US grew rapidly between 1950 and 1970. Since then, however, the increase has been smaller.Source: U.S. Census Bureau (2006).
Global Economy and US Class Structure Global economic expansion • Jobs changed from manufacturing to service work. • Creates upward mobility for educated people • Investments for those with money • Downsizing in companies affects average workers. • Many US families working harder to stay afloat
Extent of Poverty • Relative poverty–The deprivation of some people in relation to those who have more • Absolute poverty–A deprivation of resources that is life-threatening • Poverty line • About three times what the government estimates people must spend for food. • The income of the average poor family is 60% of this amount. • Extent of US poverty • 12.6% (37 million) are impoverished.
Figure 11.4 The Poverty Rate in the United States, 1960-2005The share of our population in poverty fell dramatically between 1960 and 1970. Since then, the poverty rate has remained between 10% and 15% of the population.Source: U.S. Census Bureau (2006).
Demographics of Poverty • Age • In 2005, 35% of US poor were children. • Race and ethnicity • Two-thirds of all poor are white. • In 2005, 25% of all African Americans and 21% of Hispanics were poor. • Gender • 61% of poor are women. • Women who head households are at high risk of poverty.
Explaining Poverty • Blame the poor • The poor are mostly responsible for their own poverty. • Culture of poverty produces a self-perpetuating cycle of poverty • Time limits for welfare • Blame society • Little opportunity for work • William Julius Wilson: Little opportunity for work; not enough jobs to support families
The Working Poor • In 2005, 18% of heads of poor families worked at least 50 weeks a year. • Individual ability and personal effort play a part in shaping social position. • However, society is the primary cause of poverty. • A rising share of available jobs offers only low wages
Homeless • No precise count • Experts estimate 754,000 on any given night • Causes • Poverty • One-third are substance abusers • One-fourth are mentally ill • Many homeless are entire families due to structural changes in economy.
Global Stratification Patterns of social inequality in the world as a whole
Changing Terminology • Old terminology • First world–Industrial rich countries • Second world–Less industrial socialist countries • Third world–Non-industrial poor countries • Problems with old terminology • After the Cold War, the second world no longer existed. • Third World is too economically diverse to be meaningful.