Download
1 / 39
400 likes | 1.17k Vues
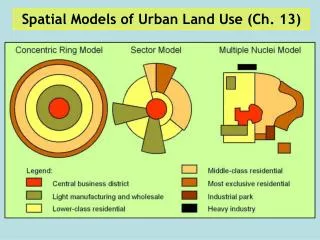
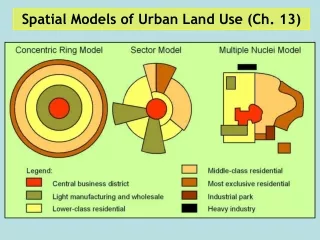
SPATIAL ARRANGEMENT OF URBAN LAND USES. Land-rent mechanism. BID-RENT CURVES. BID-RENT THEORY. Economic consideration A comparison of bid-rent curves of various land uses Steepness Areal extent Peak land value It gives rise to different land use zones. COMPARISON OF RESIDENTIAL UNITS.

E N D
SPATIAL ARRANGEMENT OF URBAN LAND USES Land-rent mechanism
BID-RENT THEORY • Economic consideration • A comparison of bid-rent curves of various land uses • Steepness • Areal extent • Peak land value • It gives rise to different land use zones
BID-RENT CURVES • Differentbidding power/rental capacityon the land market • Toleranceof increasing distance from the city centre
AT THE CITY CENTRE • Highest accessibility • Transport cost ↓ • Demand for land ↑ • But land is in short supply • Competition ↑ • Bid-rent ↑
FARTHER AWAY FROM THE CITY CENTRE • Lower accessibility • Transport cost ↑ • Demand for land ↓ • But land is in abundant supply • Competition ↓ • Bid-rent ↓
SPATIAL ARRANGEMENT OF URBAN LAND USES Accessibility
RELATIONSHIP BETWEEN LAND RENT AND ACCESSIBILITY • Land rent / value is essentially a reflection of accessibility. • It is to indicate the ease or difficulty in getting from one place to another. • It may refer to cars, roads and public transport on roads / railways. • In recent years, travelators are used to increase accessibility and thus extending the land use zone to farther areas.
AREAS WITH MAXIMUM ACCESSIBILITY • At the city centre / point of centrality • It is the point closest to all other parts of the city
AREAS OF HIGH ACCESSIBILITY • Usually the focus of transport network
AREAS OF HIGH ACCESSIBILITY • Along major transport routes
AREAS OF HIGH ACCESSIBILITY • At major traffic intersections
HORIZONTAL DISTANCE DECAY • Areas of high land value (highly-accessible) • Areas of low land value (less accessible)
DISTORTION OF THE BID-RENT CURVES • High accessibility can increase the areal extent of the land use • It reduces the gradient of the bid-rent curve, i.e. more gentle bid-rent curve.
DISTORTION TO THE BID-RENT CURVES • Generally, land rent decreases with increasing distance from the city centre. • However, the simple cone with a single peak of high land value at the city centre seldom exists.
DISTORTION TO THE BID-RENT CURVES • Ridges of high land value may form along major highways or railway lines • Their presence produces ridges of high accessibility • This bids up the land value • Examples: Eastern Island Corridor / MTR Island Line leads to the formation of middle-income residential area
DISTORTION TO THE BID-RENT CURVES • Secondary peak of high land value can be found at points of high accessibility away from the city centre. • They’re usually route intersections or transport nodes • It gives rise to regional commercial centre / large shopping malls. • Examples: Festival Walk, Shopping malls in Causeway Bay and Mongkok
SECONDARY PEAK LAND VALUE • Secondary peak of high land value can also be found at the periphery of the city where junctions of major ring roads exist • The relative more accessible areas are usually occupied by low-density commercial or residential zones
VERTICAL DISTANCE DECAY EFFECT The farther away from the ground, the lower the accessibility As people take time to travel from the ground to upper floors despite the development of elevators Generally, the land rent is higher near the ground floor and lower near the upper floors.
VERTICAL DISTANCE DECAY EFFECT The basement and the ground floor are usually the most accessible locations for shoppers Supermarkets and food courts are usually found there for the customers’ convenience. These retail activities have higher profitability which can afford the high land rent.
VERTICAL DISTANCE DECAY EFFECT The accessibility decreases towards the upper floors. Shops / retail activities usually occupy the first few floors due to relative higher accessibility and pedestrian flow. The location can attract large pool of customers especially from office blocks nearby.
VERTICAL DISTANCE DECAY EFFECT The upper floors are mainly dominated by offices which do not rely on high pedestrian flow. In short, a vertical distance decay effect is observed.
EXCEPTIONS • The top floor is occupied by expensive restaurants as they have the best view of the town. • The rent is higher than other floors due to better view. • Examples: high-class restaurants in Taipei 101, Peking Road 1
CONCLUSION • Land rent is a crucial factor to explain the horizontal and vertical distance decay effect in urban area • It is greatly influenced by accessibility • Accessibility in a shopping mall can be enhanced by speedy and efficient travelator and elevator systems
ARE LAND USE ARRANGEMENTS SOLELY A MATTER OF ECONOMIC CONSIDERATION? Are there other factors determining land use arrangements?
FACTORS INCREASING LAND RENT • Good sea view / scenic view can bid up the land rent • Examples: concentration of high-income residential areas in Southern District despite its poor transport network • Places of high altitude can also bid up the land rent • Examples: high-income residential areas are found on the Peak / Ho Man Tin
OTHER FACTORS DISTORTING BID-RENT CURVES • Bid-rent is reduced by poorer local environmental factors, e.g. near sources of pollution – near sewage treatment plants, incinerators, landfill, power plants, polluting industrial areas • It produces trough of low land value • Examples: NW New Territories / Tuen Mun has a high concentration of power plants, incinerators and industrial land use. Middle-income residential areas are nearly absent in the vicinity.
CONCLUSION • Bid-rent theory is useful to explain the areal specialisation of land use in modern cities • It can also be used to explain the distribution pattern of high-order and low-order retail activities in relation to accessibility • Bid-rent is a function of accessibility • Land use arrangement is largely determined by economic factors • However, other factors are also influential, e.g. institutional factors, historical factors and social factors.
WITH REFERENCE TO BID-RENT THEORY, EXPLAIN THE PRESENCE OF MIDDLE-INCOME RESIDENTIAL ZONE IN THE NORTHERN SHORE OF EAST HONG KONG ISLAND. • The middle-income residential zone represents a ridge of high land value due to the improvement of accessibility • The frequent service of MTR Island line and speedy bus service along Eastern Island Corridor (highway) increase the accessibility of the area • The middle-income group also has high degree of private car ownership • Office workers tend to live further away from the city centre, extending the areal extent of such land useas they look for better living environment which at the same time enjoy high accessibility
WITH REFERENCE TO BID-RENT THEORY, EXPLAIN THE PRESENCE OF RETAIL ACTIVITIES IN CAUSEWAY BAY AND MONGKOK • These areas enjoy high accessibility as they are junctions of major highways and railway lines. • Causeway Bay: junctions of Cross Harbour Tunnel (north), Aberdeen Tunnel (south), Eastern Island Corridor + MTR Island Line (east), highway along the coast (west) • Mongkok: junctions of Argyle Street, Nathan Road, Waterloo Road • The high accessibility attracts customers and induces high pedestrian flow and high traffic flow • The large market ensures a higher economic rent for retail activities • The high accessibility bids up the land price, creating a secondary peak of high land value • Commercial land use outbids other land uses and becomes dominant in the area and forms a regional commercial district
THE LAND USE CHANGES IN QUARRY BAY TAI KOO AREA EXPERIENCED IN THE PAST 20 YEARS. • A gradual trend from industrial zones to major commercial centres • Improvement in accessibility due to construction of Eastern Island Corridor, MTR Island Line and Tseung Kwan O Line (enhanced linkage with CBD, urban Kowloon and new town) • Forming secondary peak of high land value • Office and commercial functions require centrality to maximize profits and the bid-rent curves are therefore steeper • The improved accessibility has bided up land price in Quarry Bay Tai Koo area, making industrial land use less profitable • As a result, industrial land use is out-bided by commercial land use. Soon, an agglomeration of commercial buildings is formed.
THE HIGH CONCENTRATION OF LOW-DENSITY RESIDENTIAL AREAS IN NORTH NEW TERRITORIES. • Development of highway systems in the New Territories improves accessibility, e.g. San Tin Highway, Tolo Harbour Highway • With the increasing private car ownership, people are attracted to live further away from the city centre • Therefore, residential land use has greater areal extent towards the periphery of the city.