Download
1 / 1
10 likes | 76 Vues
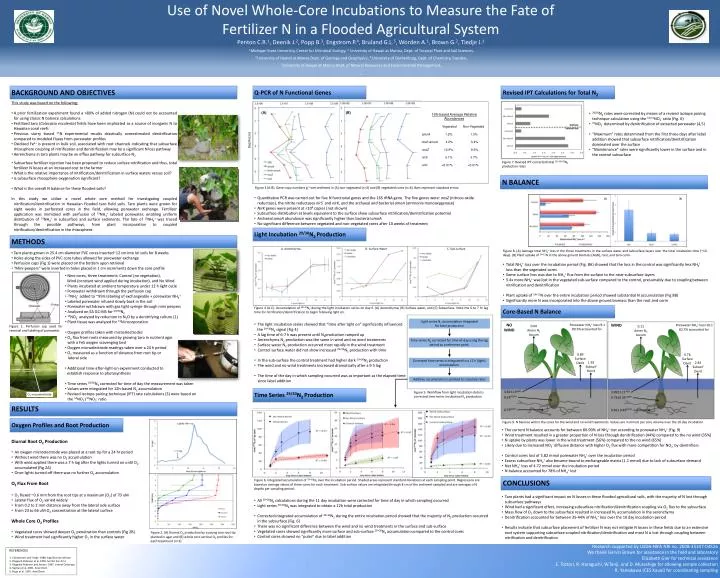
Use of Novel Whole-Core Incubations to Measure the Fate of Fertilizer N in a Flooded Agricultural System Penton C.R. 1 , Deenik J. 2 , Popp B. 3 , Engstrom P. 4 , Bruland G.L. 5 , Worden A. 1 , Brown G. 2 , Tiedje J. 1

E N D
Use of Novel Whole-Core Incubations to Measure the Fate of Fertilizer N in a Flooded Agricultural System Penton C.R.1, Deenik J.2, Popp B.3, Engstrom P.4, Bruland G.L.5, Worden A.1, Brown G.2, Tiedje J.1 1 Michigan State University, Center for Microbial Ecology, 2 University of Hawaii at Manoa, Dept. of Tropical Plant and Soil Sciences, 3 University of Hawaii at Manoa Dept. of Geology and Geophysics, 4 University of Gothenburg, Dept. of Chemistry, Sweden, 5University of Hawaii at Manoa Dept. of Natural Resources and Environmental Management, , BACKGROUND AND OBJECTIVES Q-PCR of N Functional Genes Revised IPT Calculations for Total N2 • This study was based on the following: • A prior fertilization experiment found a >80% of added nitrogen (N) could not be accounted for using classic N balance calculations • Fertilized taro (Colocasiaesculenta) fields have been implicated as a source of inorganic N to Hawaiian coral reefs • Previous slurry based 15N experimental results drastically overestimated denitrification compared to modeled fluxes from porewater profiles • Oxidized Fe3+ is present in bulk soil, associated with root channels indicating that subsurface rhizosphere coupling of nitrification and denitrification may be a significant N loss pathway • Aerenchymain taro plants may be an efflux pathway for subsurface N2 • Subsurface fertilizer injection has been proposed to reduce surface nitrification and thus, total fertilizer N losses at an increased cost to the farmer • What is the relative importance of nitrification/denitrification in surface waters versus soil? • Is subsurface rhizosphere oxygenation significant? • What is the overall N balance for these flooded soils? • In this study we utilize a novel whole core method for investigating coupled nitrification/denitrification in Hawaiian flooded taro field soils. Taro plants were grown for eight weeks in perforated cores in the field, allowing porewater exchange. Fertilizer application was mimicked with perfusion of 15NH4+ labeled porewater, enabling uniform distribution of 15NH4+ in subsurface and surface sediments. The fate of 15NH4+ was traced through the possible pathways, from plant incorporation to coupled nitrification/denitrification in the rhizosphere. (A) (B) • 29/30N2 rates were corrected by means of a revised isotope pairing technique calculation using the 14/15NO3- ratio (Fig. 6) • 15NO3- determined by denitrification of extracted porewater (4,5) • “Maximum” rates determined from the first three days after label addition showed that subsurface nitrification/denitrification dominated over the surface • “Maintenance” rates were significantly lower in the surface and in the control subsurface 16S-based Average Relative Abundances Vegetated Non-Vegetated amoA 1.2% 1.5% Arch-amoA4.0% 3.4% nosZ12.9% 9.6% nirS 5.1% 3.7% nirK <0.01% <0.01% Surface Subsurface Depth (cm) Figure 7. Revised IPT-corrected total 28+29+30N2 production rates N BALANCE Figure 3 (A-B). Gene copy numbers g-1 wet sediment in (A) non-vegetated (n=3) and (B) vegetated cores (n=6). Bars represent standard errors. • Quantitative PCR was carried out for five N functional genes and the 16S rRNA gene. The five genes were: nosZ (nitrous oxide reductase), the nitrite reductasesnirS and nirK, and thearchaealand bacterial amoA (ammonia monooxygenase) • NirK genes were present at <104 copies (not shown) • Subsurface distribution at levels equivalent to the surface show subsurface nitrification/denitrification potential • ArchaealamoAabundance was significantly higher than bacterialamoA • No significant difference between vegetated and non-vegetated cores after 10 weeks of treatment (A) (B) WIND NO WIND Porewater NH4+ loss=10.1 82.7% accounted for Porewater NH4+ loss=9.1 89.5% accounted for 0.04 Aeren N2 Accum 0.11 Aeren N2 Accum Light Incubation 29/30N2 Production METHODS A. Aerenchyma B. Surface Water C. Sub-surface • Taro plants grown in 25.4 cm diameter PVC cores inserted~12 cm into loisoils for 8 weeks • Holes along the sides of PVC core tubes allowed for porewater exchange • Perfusion caps (Fig 1) were placed on the bottom upon retrieval • “Mini-peepers” were inserted in holes placed in 1 cm increments down the core profile 0.76 Surface Denit 0.89 Surface Denit 1.93 Subsurf Denit 2.83 Subsurf Denit • Total NH4+ loss over the incubation period (Fig. 8A) showed that the loss in the control was significantly less NH4+ loss than the vegetated cores • Some surface loss was due to NH4+ flux from the surface to the near-subsurface layers • 5.4x more NH4+ was lost in the vegetated sub-surface compared to the control, presumably due to coupling between nitrification and denitrification • Plant uptake of 14+15N over the entire incubation period showed substantial N accumulation (Fig 8B) • Significantly more N was incorporated into the above ground biomass than the root and corm • Nine cores, three treatments: Control (no vegetation), • Wind (constant wind applied during incubation), and No Wind • Plants incubated at ambient temperature under 12 h light cycle • Porewater withdrawn through the perfusion cap • 15NH4+ added to ~95% labeling of exchangeable + porewater NH4+ • Labeled porewater infused slowly back in the soil • Porewater withdrawn with gas tight syringe through mini peepers • Analyzed on EA GC-MS for 29/30N2 • 15NO3- analyzed by reduction to N2O by a denitrifying culture (1) • Plant tissue was analyzed for 15Nincorporation • Oxygen profiles taken with microelectrodes • O2 flux from roots measured by growing taro in nutrient agar • with a FeS oxygen scavenging bed • Oxygen microelectrode readings taken over a 24 h period • O2 measured as a function of distance from root tip or • lateral side • Additional time-after-light-on experiment conducted to • establish response to photosynthesis • Time series 29/30N2 corrected for time of day the measurement was taken • Values were integrated for 12h-based N2 accumulation • Revised isotope pairing technique (IPT) rate calculations (3) were based on the 14NO3-/15NO3- ratio Figure 8. (A) Average total NH4+ loss in the three treatments in the surface water and subsurface layers over the total incubation time (~10 days). (B) Plant uptake of 14+15N in the above ground biomass (AGB), root, and taro corm. 3.92±1.9AGB 3.09±1.11AGB 0.58CORM 0.75±0.35CORM Figure 4 (A-C). Accumulation of 29+30N2 during the light incubation series on day 6. (A) Aerenchyma, (B) Surface water, and (C) Subsurface. Note the 6 to 7 hr lag time for nitrification/denitrification to begin following light on. Core-Based N Balance 0.79ROOT 0.81± 0.49ROOT Light series N2 accumulation integrated for total production • The light incubation series showed that “time after light on” significantly influenced • the 29+30N2 signal (Fig 4) • A lag time of 6-7 h was present until N2production ramped up • AerenchymaN2 production was the same in wind and no wind treatments • Surface water N2 production occurred most rapidly in the wind treatment • Control surface water did not show increased 29+30N2 production with time • In the sub-surface the control treatment had higher dark 29+30N2 production • The wind and no wind treatments increased dramatically after a 9 h lag • The time of the day in which sampling occurred was as important as the elapsed time since label addition Figure 1. Perfusion cap used for removal and labeling of porewater. Time series N2 corrected for time-of-day using the lag period as a reference point Figure 6. Integrated accumulation of 29+30N2 over the incubation period. Shaded areas represent standard deviations at each sampling point. Regressions are based on average values of three cores for each treatment. Sub-surface values are integrated through 8 cm of the sediment sampled and are averages of 6 depths per sampling period. Corrected time series is integrated to a 12 h (light) accumulation Additive accumulation is plotted to calculate rates Time Series 29/30N2 Production Figure 5. Workflow from light incubation data to corrected time series incubation N2 production O2 microelectrode RESULTS Oxygen Profiles and Root Production • The current N balance accounts for between 80-90% of NH4+ lost according to porewater NH4+ (Fig. 9) • Wind treatment resulted in a greater proportion of N loss through denitrification (44%) compared to the no wind (35%) • N uptake by plants was lower in the wind treatment (56%) compared to the no wind (65%) • Likely due to increased NO3- diffusive distance with higher O2 flux with more competition for NO3- by denitrifiers • Control cores lost of 5.82 mmol porewater NH4+ over the incubation period • Excess subsurface NH4+ also became bound to exchangeable matrix (1.1 mmol) due to lack of subsurface demand • Net NH4+ loss of 4.72 mmol over the incubation period • N balance accounted for 78% of NH4+ lost • Taro plants had a significant impact on N losses in these flooded agricultural soils, with the majority of N lost through subsurface pathways • Wind had a significant effect, increasing subsurface nitrification/denitrification coupling via O2 flux to the subsurface • Mass flow of O2 down to the subsurface resulted in increased N2 accumulation in the aerenchyma • Denitrification accounted for between 35-44% of NH4+ loss over the 10 day incubation period • Results indicate that subsurface placement of fertilizer N may not mitigate N losses in these fields due to an extensive root system supporting subsurface coupled nitrification/denitrification and most N is lost through coupling between nitrification and denitrification Figure9. N balance within the cores for the wind and no wind treatments. Values are in mmols per core volume over the 10 day incubation • Diurnal Root O2 Production • An oxygen microelectrode was placed at a root tip for a 24 hr period • Without wind there was no O2 accumulation • With wind applied there was a 7 h lag after the lights turned on until O2 accumulated (Fig 2A) • Once lights turned off there was no further O2 accumulation • O2 Flux From Root • O2 fluxed ~0.6 mm from the root tips at a maximum [O2] of 70 uM • Lateral flux of O2 varied widely: • From 0.2 to 2 mm distance away from the lateral side surface • From 23 to 66 uM O2 concentration at the lateral surface • Whole Core O2 Profiles • Vegetated cores showed deeper O2 penetration than controls (Fig 2B) • Wind treatment had significantly higher O2 in the surface water CONCLUSIONS • All 29+30N2 calculations during the 11 day incubation were corrected for time of day in which sampling occurred • Light series 29+30N2 was integrated to obtain a 12h total production • Corrected integrated accumulation of 29+30N2 during the entire incubation period showed that the majority of N2 production occurred in the subsurface (Fig. 6) • There was no significant difference between the wind and no wind treatments in the surface and sub-surface • Vegetated cores showed significantly more surface and sub-surface 29+30N2 accumulation compared to the control cores • Control cores showed no “pulse” due to label addition Figure 2. (A) Diurnal O2 production by a young taro root tip planted in agar and (B) whole core vertical O2 profiles for each treatment (n=3) Research supported by USDA-NIFA NRI no. 2008-35107-04526 We thank Garvin Brown for assistance in the field and laboratory Elizabeth Gier for technical assistance E. Tottori, R. Haraguchi, W.Tanji, and D. Murashige for allowing sample collection R. Yamakawa (CES Kauai) for coordinating sampling REFERENCES 1. Christensen and Tiedje. 1988. Appl Environ Microb 2. Risgaard-Petersen et al. 1995. Soil Sci Soc Am J 3. Risgaard-Petersen and Jensen. 1997. Limnol Oceanogr 4. Sigman et al. 2001. Anal Chem 5. Popp et al. 1995. Anal Chem