Download
1 / 26
260 likes | 330 Vues
Pendleton, Oregon Research Region Map Types and Lightning Frequencies. Henry Fuelberg Pete Saunders. Map Typing (Pattern Classification).

E N D
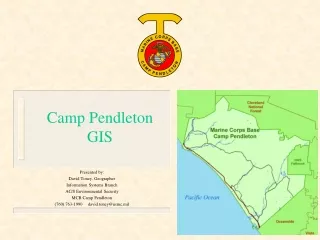
Pendleton, Oregon Research Region Map Types and Lightning Frequencies Henry Fuelberg Pete Saunders
Map Typing (Pattern Classification) • In developing the model for lightning probability forecasts, we created pattern-type lightning frequencies that will be used as candidate predictors. As in Shafer and Fuelberg (2006), we believe these predictors will provide detailed information on local lightning enhancements that are not adequately resolved by the NCEP models. The goal is to capture local interactions between the low-level winds and thermal circulations. • A correlation technique described by Lund (1963) and Reap (1994a) was used to develop what we call “map-type predictors”. The correlation technique was applied to 3-hourly observed 850-hPa geopotential height fields from RUC analyses. The time period is the warm season months (May-September) from 2001 to 2007. We believe that the 850-hPa level provides the best indication of low-level flow in terms of both direction and speed. • The RUC-20 and RUC-40 geopotential height values were interpolated onto a coarser 50-km grid in order to smooth the smaller-scale variations and to capture the regional characteristics of the low level flow.
Map Typing (Pattern Classification) • Only time periods when the geopotential height map could be correlated at 0.8 or greater (Lund 1963; Reap 1994a) were used in creating the map types. However, unclassified maps were assigned to the map type in which they were most correlated for model equation development. This also is represented in the map type means and frequencies. • For each map type and 3 hourly period, relative lightning frequencies then were calculated. • The unconditional mean number of flashes also was calculated for every 3-h period and map type. • Details of these procedures follow.
Map Typing Procedures We used the following procedures to determine pattern type classification: • Gathered RUC-20 and RUC-40 data of geopotential heights at various levels. RUC-40 data were used for the years 2001 through 2004. RUC-20 data were used for the years 2005 through 2007, giving a total of 7 years of height data. • Grid points for the Pendleton, OR research region were subset for the following lat/lon coordinates: Latitude: 40.0 N through 49.0 N Longitude: -115.0 W through -126.0 W
Map Typing Procedures • 3-h geopotential height data were extracted from the grib files for each day during the 7 year period to create a total of 8265 maps. • Each 3-h period then was interpolated onto a 100-km grid from the initial 20-km and 40-km grids. • From here, each 3-h RUC geopotential height map was correlated with every other map in the sample to determine the map types. For example, maps correlated at the R=0.8 threshold were placed into Map Type A. Then, every map that was determined to be of Type A was removed, and a new correlation matrix was created to determine Map Type B at the same threshold. This correlation process then was repeated to produce 5 total map types (A – E).
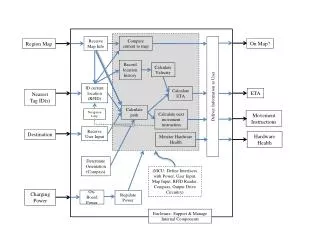
Map Type Frequencies and Means • We then completed the following steps to relate lightning to the map types that had been created: 1. Read in the list of lat/lon values for each grid point. 2. Read in the time and lat/lon location of each flash in the monthly .lga file. 3. Created a program that determined if the flash lies within the specified radius of each grid point by computing the separation distance (km) between the flash and the grid point. The calculation of separation distance used a formula for the great circle distance on a sphere. 4. If the computed separation distance was <= to the specified counting radius, then the flash count for the grid point for the particular hour was incremented by one. 5. Hourly grids were written to separate output files for each month. 6. Created a program that read the monthly grid files and summed the hourly flashes into 3-hourly totals.
Map Type Frequencies and Means • Finally, we computed map type lightning frequencies as well as the mean number of flashes for each grid point for each 3-hr period, using data for the 7-yr period 2001-2007. - We should note that a simple mean number of flashes can be heavily influenced by single events with a large number of flashes (i.e., outliers), which can cause the plots to be somewhat noisy. As an alternative, we calculated a "trimmed" mean whereby the upper and lower 2% of the data were excluded from the calculation. The resulting mean is much more resistant to outliers. - The computed frequencies represent the following: - Likewise, the computed “trimmed” means represent the following:
Lightning Percentiles Percentile of flash count for each 3-h period
A Few Statistics * 8265 Total Maps
Map Types • High Pressure (weak ridging) to the south over northern California/NW Nevada. Relatively strong southwesterly flow across the region H
Map Types • Low Pressure to the north over Washington; indicates weaker zonal/southwesterly flow over the region. L
Map Types • Stronger ridging to the south. Weaker low-level flow to the north and calm flow across most of Oregon, California, Nevada. H
Map Types L • Low Pressure well northwest of the region (in the North Pacific Ocean) inducing weak southwesterly flow across the region at a rather large angle (~45°)
Map Types • Low pressure eastern Washington; troughing throughout much of the region, especially in E/NE portions of Oregon. L
Map Type Frequencies and Means • The following map type frequencies and means reflect the time period of 0000-0259 UTC. This is the time period in which the 95th percentile of lightning flashes was most common.
Map Type Means Sum Flashes/Total # of Maps in Map Type A
Map Type Means Sum Flashes/Total # of Maps in Map Type B
Map Type Means Sum Flashes/Total # of Maps in Map Type C
Map Type Means Sum Flashes/Total # of Maps for Map Type D
Map Type Means Sum Flashes/Total # of Maps for Map Type E
Additional Predictors • The map type means and frequencies will be candidate predictors for the lightning probability model, and likely will be selected as final predictors. However, the following candidate parameters also will be tested statistically using the SPSS software to determine their legitimacy for inclusion in the final predictor set. Binary logistic regression techniques will be implemented to determine the significance of each parameter and how much weight it should be assigned: • Equivalent Potential Temperature • Theta-E Advection • Thickness • Price Rind (Lightning Frequency in flashes per minute based on cloud top height (km) • Convective Inhibition • Divergence • Most unstable CAPE • Mean Wind Speed • Precipitable Water • Showalter Stability Index • Vorticity • Lapse Rates • Moisture Flux Convergence • Temperature Advection