Download
1 / 101
1.01k likes | 1.03k Vues
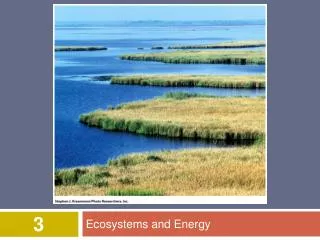
Ecosystems and Energy. 0. 42. Overview: Cool Ecosystem. An ecosystem consists of all the organisms living in a community, as well as the abiotic factors with which they interact

E N D
Overview: Cool Ecosystem An ecosystem consists of all the organisms living in a community, as well as the abiotic factors with which they interact An example is the unusual community of organisms, including chemoautotrophic bacteria, living below a glacier in Antarctica
Ecosystems range from a microcosm, such as space under a fallen log or desert spring, to a large area, such as a lake or forest
Regardless of an ecosystem’s size, its dynamics involve two main processes: energy flow and chemical cycling Energy flows through ecosystems, whereas matter cycles within them
Concept 42.1: Physical laws govern energy flow and chemical cycling in ecosystems Ecologists study the transformations of energy and matter within ecosystems
Conservation of Energy Laws of physics and chemistry apply to ecosystems, particularly energy flow The first law of thermodynamics states that energy cannot be created or destroyed, only transferred or transformed Energy enters an ecosystem as solar radiation, is transformed into chemical energy by photosynthetic organisms, and is dissipated as heat
The second law of thermodynamics states that every exchange of energy increases the entropy of the universe In an ecosystem, energy conversions are not completely efficient, and some energy is always lost as heat Continuous input from the sun is required to maintain energy flow in Earth’s ecosystems
Conservation of Mass The law of conservation of mass states that matter cannot be created or destroyed Chemical elements are continually recycled within ecosystems In a forest ecosystem, most nutrients enter as dust or solutes in rain and are carried away in water Ecosystems are open systems, absorbing energy and mass and releasing heat and waste products
Ecosystems can be sources or sinks for particular elements If a mineral nutrient’s outputs exceed its inputs it will limit production in that system
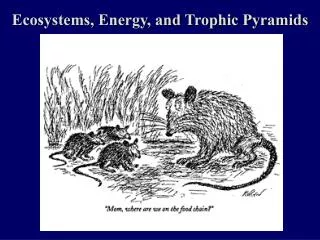
Energy, Mass, and Trophic Levels Autotrophs build molecules themselves using photosynthesis or chemosynthesis as an energy source Heterotrophs depend on the biosynthetic output of other organisms
Energy and nutrients pass from primary producers (autotrophs) to primary consumers (herbivores) to secondary consumers (carnivores) to tertiary consumers (carnivores that feed on other carnivores)
Detritivores,or decomposers, are consumers that derive their energy from detritus, nonliving organic matter Prokaryotes and fungi are important detritivores Decomposition connects all trophic levels; detritivores are fed upon by secondary and tertiary consumers
Figure 42.4 Sun Key Chemical cycling Heat Energy flow Primary producers Primary consumers Detritus Microorganisms and other detritivores Secondary and tertiary consumers
Concept 42.2: Energy and other limiting factors control primary production in ecosystems In most ecosystems, primary production is the amount of light energy converted to chemical energy by autotrophs during a given time period In a few ecosystems, chemoautotrophs are the primary producers
Ecosystem Energy Budgets The extent of photosynthetic production sets the spending limit for an ecosystem’s energy budget
The Global Energy Budget The amount of solar radiation reaching Earth’s surface limits the photosynthetic output of ecosystems Only a small fraction of solar energy actually strikes photosynthetic organisms, and even less is of a usable wavelength
Gross and Net Production Total primary production is known as the ecosystem’sgross primary production (GPP) GPP is measured as the conversion of chemical energy from photosynthesis per unit time
Net primary production (NPP) is GPP minus energy used by primary producers for “autotrophic respiration” (Ra) NPP is expressed as Energy per unit area per unit time (J/m2 yr), or Biomass added per unit area per unit time (g/m2 yr) NPP = GPP − Ra
NPP is the amount of new biomass added in a given time period Only NPP is available to consumers Standing crop is the total biomass of photosynthetic autotrophs at a given time Ecosystems vary greatly in NPP and contribution to the total NPP on Earth
Figure 42.5 Technique 80 Snow Clouds 60 Vegetation Percent reflectance 40 Soil 20 Liquid water 0 400 600 800 1,000 1,200 Visible Near-infrared Wavelength (nm)
Tropical rain forests, estuaries, and coral reefs are among the most productive ecosystems per unit area Marine ecosystems are relatively unproductive per unit area but contribute much to global net primary production because of their volume Video: Oscillatoria
Figure 42.6 Net primary production (kg carbon/m2 • yr) 3 2 1 0
Net ecosystem production (NEP) is a measure of the total biomass accumulation during a given period NEP is gross primary production minus the total respiration of all organisms (producers and consumers) in an ecosystem (RT) NEP = GPP − RT
NEP is estimated by comparing the net flux of CO2 and O2 in an ecosystem, two molecules connected by photosynthesis The release of O2 by a system is an indication that it is also storing CO2
Primary Production in Aquatic Ecosystems In marine and freshwater ecosystems, both light and nutrients control primary production
Light Limitation Depth of light penetration affects primary production in the photic zone of an ocean or lake About half the solar radiation is absorbed in the first 15 m of water, and only 5–10% reaches a depth of 75 m
Nutrient Limitation More than light, nutrients limit primary production in geographic regions of the ocean and in lakes A limiting nutrient is the element that must be added for production to increase in an area Nitrogen and phosphorous are the nutrients that most often limit marine production Nutrient enrichment experiments confirmed that nitrogen was limiting phytoplankton growth off the shore of Long Island, New York
Figure 42.7 Results 30 Ammonium enriched Phosphate enriched 24 Unenriched control 18 Phytoplankton density (millions of cells per mL) 12 6 0 A B C D E F G Collection site
Experiments in the Sargasso Sea in the subtropical Atlantic Ocean showed that iron limited primary production
Upwelling of nutrient-rich waters in parts of the oceans contributes to regions of high primary production The addition of large amounts of nutrients to lakes has a wide range of ecological impacts
In some areas, sewage runoff has caused eutrophication of lakes, which can lead to loss of most fish species In lakes, phosphorus limits cyanobacterial growth more often than nitrogen This has led to the use of phosphate-free detergents
Primary Production in Terrestrial Ecosystems In terrestrial ecosystems, temperature and moisture affect primary production on a large scale Primary production increases with moisture
Figure 42.8 1,400 1,200 1,000 Net annual primary production (above ground, dry g/m2 • yr) 800 600 400 200 0 20 40 60 80 100 120 140 160 180 200 Mean annual precipitation (cm)
Actual evapotranspiration is the water transpired by plants and evaporated from a landscape It is affected by precipitation, temperature, and solar energy Actual evapotranspiration can be used as a predictor of net primary production
On a more local scale, a soil nutrient is often the limiting factor in primary production In terrestrial ecosystems, nitrogen is the most common limiting nutrient Phosphorus can also be a limiting nutrient, especially in older soils Nutrient Limitations and Adaptations That Reduce Them
Various adaptations help plants access limiting nutrients from soil Some plants form mutualisms with nitrogen-fixing bacteria Many plants form mutualisms with mycorrhizal fungi; these fungi supply plants with phosphorus and other limiting elements Roots have root hairs that increase surface area Many plants release enzymes that increase the availability of limiting nutrients
Concept 42.3: Energy transfer between trophic levels is typically only 10% efficient Secondary production of an ecosystem is the amount of chemical energy in food converted to new biomass during a given period of time
Production Efficiency When a caterpillar feeds on a leaf, only about one-sixth of the leaf’s energy is used for secondary production Net secondary production is the energy stored in biomass An organism’sproduction efficiency is the fraction of energy stored in food that is not used for respiration Production efficiency Net secondary production × 100% Assimilation of primary production =
Figure 42.9 Plant material eaten by caterpillar 200 J 67 J Cellular respiration 100 J Feces 33 J Not assimilated Assimilated Growth (new biomass; secondary production)
Birds and mammals have efficiencies in the range of 13% because of the high cost of endothermy Insects and microorganisms have efficiencies of 40% or more
Trophic Efficiency and Ecological Pyramids Trophic efficiency is the percentage of production transferred from one trophic level to the next, usually about 10% Trophic efficiencies take into account energy lost through respiration and contained in feces, as well as the energy stored in unconsumed portions of the food source Trophic efficiency is multiplied over the length of a food chain
Approximately 0.1% of chemical energy fixed by photosynthesis reaches a tertiary consumer A pyramid of net production represents the loss of energy with each transfer in a food chain
Figure 42.10 Tertiary consumers 10 J Secondary consumers 100 J Primary consumers 1,000 J Primary producers 10,000 J 1,000,000 J of sunlight
In a biomass pyramid, each tier represents the standing crop (total dry mass of all organisms) in one trophic level Most biomass pyramids show a sharp decrease at successively higher trophic levels
Figure 42.11 Dry mass (g/m2) Trophic level Tertiary consumers 1.5 Secondary consumers 11 Primary consumers 37 809 Primary producers (a) Most ecosystems (data from a Florida bog) Dry mass (g/m2) Trophic level Primary consumers (zooplankton) 21 Primary producers (phytoplankton) 4 (b) Some aquatic ecosystems (data from the English Channel)