Download
1 / 60
600 likes | 600 Vues
Learn about how K-12 school funding works, the distribution principles, and the equalization formula in place to ensure equity between school districts.

E N D
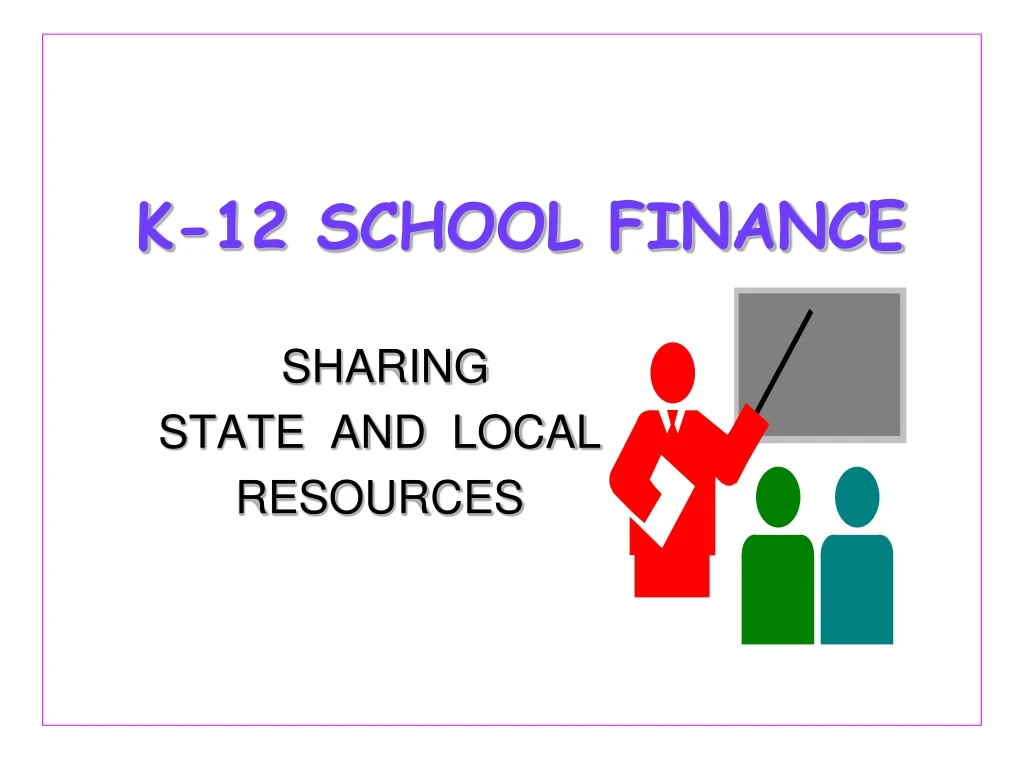
K-12 SCHOOL FINANCE SHARING STATE AND LOCAL RESOURCES
K-12 Dollars Pay For • Teaching 565,000 Students • Employing 40,000 Teachers & Aids • Employing 22,000 Support Staff • Operating 1,300 School Sites • Operating 197 School Districts
Three Levels of Equity • Between all school districts and all ESDs • Between 197 school districts • Between 20 ESDs
SCHOOL AND ESD SHARESTotal $ Available State School Fund - Off-the-top Special Uses = State School Fund Balance Available + School and ESD Local Revenue = School and ESD Allocation Funds
K-12 SCHOOL AND ESD SHARESStarting in 2006-07 School and ESD Allocation Funds x 95.25% x 4.75% K-12 School Share ESD Share - - School Local Rev. ESD Local Rev. = = School SSF Share ESD SSF Share
K-12 & ESD Revenue2007-09 Biennium State and Local =$8.8 billion
K-12 SCHOOL EQUALIZATION FORMULA State School Fund
What Funding Formula is Not About: • General cost reimbursement • Revenue entitlement per student • Funding adequacy or stability • Student outcomes or achievement • District or school • Quantity of inputs • Program quality • Accountability
What Funding Formula is About: • Defining school district “equity” • Measuring the ‘relative need’ of districts for funding given certain student and district characteristics • Reflecting the finance issues and court decisions in the 1980s • Refining “equity” by legislative policy choices over time
Distribution Principles • Share school funding sources statewide • Method: Allocate all state and local operating revenue • Let each district decide how to spend its allocation • Method: Give state aid in lump sum, not categorical grants • Adjust funding only for uncontrollable cost differences Method: Justify revenue differences in a rational manner • Avoid incentives to increase district allocation • Method: Minimize classifications and set limits
Equalization Formula STATE REVENUE + LOCAL REVENUE EQUALS High Cost Disability Grant General Purpose Grant Transpor-tation Grant + + + Facility Grant
STATE SCHOOL FUND2007-09 Biennium $5.98 billion
State School Fund2007-09 Appropriation used for: • Small High Schools ($5 million) • State Special Education ($18.6 million) • Virtual School ($1.8 million) • Business Practices Audit ($0.8 million) • YCEP/JCEP ($5.2 million) • PE Grants ($0.9 million) • Virtual School District ($1.8 million) • Talented and Gifted ($0.35 million)
Local Formula Revenue • Operating property taxes collected • Common School Fund • County School Fund • Federal forest related revenue • State managed county trust forests • ESD excess local revenue • Revenue in lieu of property taxes
Local Formula Revenue2007-09 Biennium $2.7 billion
Equalization Formula STATE REVENUE + LOCAL REVENUE EQUALS High Cost Disability Grant General Purpose Grant Transpor-tation Grant + + + Facility Grant
Equalization FormulaCost Factors • Student Cost Weights • Teacher Experience Adjustment • Transportation Costs • High Cost Disability Students (03-04) • New Facility Costs (99-00)
Facility Grant Equals Up to 8% of Construction Costs • Prorated if biennial total exceeds $25 mil. • Cannot be used for construction • Paid in school year facility first used
High Cost Disability Grant Equals Up to Sum of Eligible Costs above $30,000 per Disability Student • Grant limited to $18 million per year • Costs prorated if total above $18 million • Passed in 2003 for two years at $25,000; made permanent in 2005 at $30,000 • Costs include ESD costs for student
TransportationGrant Equals 70% to 90% of Approved Transportation Costs
Transportation Percent Districts ranked by cost per student from high to low
Transportation Costs Approved costs: • Elementary students more than 1 mile away • Secondary students more than 1.5 miles away • Between school sites • Preschool handicapped students • Students on field trips • Room and board in lieu of transportation
General Purpose Grant Equals Weighted Students X $4,500 Adjusted by Teacher Experience and Balanced to Available Funds
Formula Student Counts • ADM - Average daily membership with kindergarten at half-weight • ADMw - ADM adjusted by student cost weights • Extended ADMw - Higher of current or prior year ADMw
Student Cost WeightsSpecial Education and at Risk Total Weight Individual Education Program (IEP) 2.00 Students in poverty 1.25 English as Second Language (ESL) 1.50 Pregnant and parenting 2.00 Neglected and Delinquent 1.25 Students in Foster Homes 1.25
IEP 1 Extra Weight • IEP students are 13.3% of ADM • Limited to 11% of ADM without waiver • 33 districts below 11%; 156 above 11% • Waivers for about 4,600 IEP students • About 89% of IEP students have a weight • In 2004-05 about half of the districts report IEP costs less than IEP revenue (including federal and ESD $) Note: Preliminary data for 2007-08
ESL Extra ½ Weight • 128 districts report ESL students • ESL students are about 10% of ADM • Report using 2003-04 data: • Only 12 districts reported costs more than weight revenue • Costs averaged about $1,500 per ESL student • Extra weight revenue was about $2,600 per ESL student (excludes federal funds)
Student Cost WeightsGrades and School Weight Kindergarten .50 Elementary district students .90 Union High district students 1.20 Remote small elementary schools Varies Small high schools Varies
Small High School Qualification • School in a district under 8,500 ADMw • Location unchanged since 1995 • Existed as small high school in 1999 • ADM less than 350 for 4 grades • ADM less than 267 for 3 grades
Small Elementary School Qualification • Existed as remote small school in 1995 • Location unchanged since 1995 • ADM below 224 for 8 grades (limit varies with number of grades) • More than 8 miles to nearest elementary (exception for physiographic conditions)
Teacher Experience Adjustment District Average Experience State Average Experience $25 X EXAMPLES: $25 X (14.7 - 12.7) = + $50 per student $25 X (11.7 - 12.7) = - $25 per student
General Purpose Grant Equals Teacher Experience Adjustment ADMw Extended $4,500 Target Balance Ratio X + X
Equalization Formula STATE REVENUE + LOCAL REVENUE EQUALS $4,500 adjusted by teacher experience and balanced to total funds Student ADMw Extended 70%-90% of Transportation Costs + X Up to sum of Costs above $30,000 per Disability Student Up to 8% of Construction Costs + +
K-12 School Formula Revenue2007-08 Total $4.1 billion
K-12 FUNDING HISTORY State School Fund and Local Revenue
K-12 Equalization ResultsDistricts with More Than 500 ADM 2006-07 Revenue per ADMw 1991-92 Revenue per ADMw
EDUCATION SERVICE DISTRICTS (ESDs)
ESD Equalization General Logic • ESDs provide services to school districts • ESD costs are related to school district costs • The school equalization formula weights students for cost differences • ESD revenue should be proportional to the formula revenue of its school districts
ESD Allocation(Starting in 2006-07) Sum of Component School District Formula Revenue Base Revenue = 4.987% X
ESD Allocation(Starting in 2006-07) State Revenue + Local Revenue Equals (1) % to Balance X Base Revenue (2) $1,000,000 Higher of:
LOCAL OPTION PROPERTY TAX 1999 HB2753
Exclusion From Formula Local Revenue Excludes the lesser of: • Property tax gap between M5 and M50 • 20% of formula revenue • $1,000 per student x students • Note: Students are weighted.