Download
1 / 23
240 likes | 437 Vues
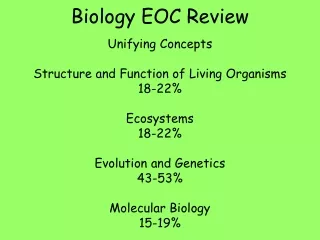
Biology EOC Data Analysis. 29 April 2014. Two Ways to Measure Performance. 1. Proficiency – How did students perform compared to a set of standards 2. Growth – How did teachers’ students improve relative to their peers across the state Exceeds Expected Growth Meets Expected Growth

E N D
Biology EOC Data Analysis 29 April 2014
Two Ways to Measure Performance 1. Proficiency – How did students perform compared to a set of standards 2. Growth – How did teachers’ students improve relative to their peers across the state • Exceeds Expected Growth • Meets Expected Growth • Does Not Meet Expected Growth
1. Proficiency -13 -17
1. Proficiency -10
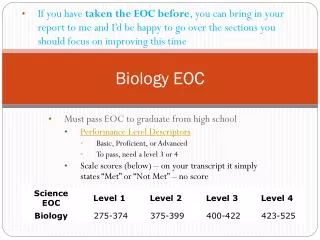
School Achievement Calculation 1. Proficiency 3-8 Reading % Proficient + 3-8 Math % Proficient + 5&8 Science % Proficient Math I % Proficient Biology % Proficient + English II % Proficient + + = Points # of Available Indicators 0% (0/0) + 0% (0/0) + 0% (0/0) 31.7% (159/500) 35.4% (177/500) + 38.3% (192/500) + + = 35.1 3
Teacher Growth Index Levels 2. Growth (From EVAAS)
Biology EOC (2012-2013) 2. Growth 13% 27% 60% Average = -27.6
Spring 2013 District EOC results 1. Proficiency Diff from State Mean % of test Structure and Function of Organisms 20.1 -4.4 Ecosystems 20.1 -2.4 Evolution and Genetics 45.3 -3.3 Molecular Biology 14.5 -5.2
assignment On WCPS Science Website • Materials: Summary Goal Report Released test (2013) EOC analysis worksheet Science Essential Standards doc. Unpacked Standards doc. • Find lowest area on Report • Find which questions these correlate to on released test. (Unifying Concepts in answer key) • Determine which Clarifying Objective correlates to each question. • Summarize the questions on worksheet. • Submit copies of worksheets.
Biology Summary Goal Report 1. Find lowest area Diff from State Mean % of test Structure+Function Living Organisms 20.1 -4.4 Ecosystems 20.1 -2.4 Evolution and Genetics 45.3 -3.3 Molecular Biology 14.5 -5.2
Unifying Concept Essential Standards document
3. Do this with the rest of the questions Bio.4.1.1 Bio.4.1.2
Potential snag with printed Released test • A few question items show up Online Only • Download the Online test from WCPS science page
5. Submit copies of worksheets. • Teachers submit to Science Chair • Chair sends to Andy Forsleff @ C/O after collecting all