Download
1 / 41
420 likes | 541 Vues
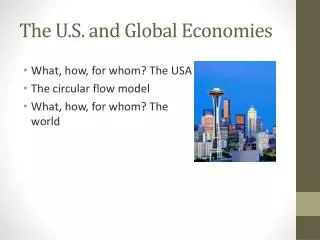
2. The U.S. and Global Economies. CHAPTER CHECKLIST. When you have completed your study of this chapter, you will be able to. 1 Describe what, how, and for whom goods and services are produced in the United States.

E N D
2 • The U.S. and Global Economies • CHAPTER CHECKLIST • When you have completed your study of this chapter, you will be able to • 1Describe what, how, and for whom goods and services are produced in the United States. • 2 Describe what, how, and for whom goods and services are produced in the global economy. • 3 Use the circular flow model to provide a picture of how households, firms, and governments interact.
2.1 WHAT, HOW, AND FOR WHOM? • What Do We Produce? • We divide the vast array of goods and services produced into: • Consumption goods and services • Capital goods • Government goods and services • Export goods and services 總體恆等式:消費,投資,政府支出,淨出口
2.1 WHAT, HOW, AND FOR WHOM? • Consumption goods and services are goods and servicesthat are bought by individuals and used to provide personal enjoyment and contribute to a person’s standard of living. • Examples are movies and laundromat services. • Capital goods are goods that are bought by businesses to increase their productive resources. • Examples are cranes and trucks.
2.1 WHAT, HOW, AND FOR WHOM? • Government goods and services are goods and servicesthat are bought by governments. • Examples are missiles, bridges, and police protection. • Export goods and services are goods and services produced in one country and sold in other countries. • Examples are airplanes produced by Boeing and Citicorp banking services sold to China.
2.1 WHAT, HOW, AND FOR WHOM? Figure 2.1(a) shows the relative magnitudes of the goods and services produced in 2009: Consumption 62% Capital goods 10% Export goods 10% Government 18%
2.1 WHAT, HOW, AND FOR WHOM? • Figure 2.1(b) shows the largest six types of services produced in 2009, and the largest four types of goods produced.
2.1 WHAT, HOW, AND FOR WHOM? • How Do We Produce? • Factors of productionare the productive resources used to produce goods and services. • Factors of production are grouped into four categories: • Land 土地 • Labor, human capital 勞動力,人力資本 • Capital 實質資本 • Entrepreneurship 企業家精神
2.1 WHAT, HOW, AND FOR WHOM? • Land includes all the things we call natural resources. • Land includes minerals, water, air, wild plants, animals, birds, and fish as well as farmland and forests. • Labor is the work time and work effort. The quality of labor depends on how skilled people: human capital. • Human capitalis the knowledge and skill that people obtain from education, on-the-job training, and work experience.
2.1 WHAT, HOW, AND FOR WHOM? • Capital consists of tools, instruments, machines, buildings, and other items that have been produced in the past and that businesses now use to produce goods and services. • Capital does not include money, stocks, and bonds. They are financial resources. • Entrepreneurship is the human resource that organizes labor, land, and capital. • Entrepreneurscome up with new ideas about what and how to produce, make business decisions, and bear the risks that arise from these decisions.
2.1 WHAT, HOW, AND FOR WHOM? • For Whom Do We Produce? Factors of production are paid incomes: 地租RentIncome paid for the use of land. 工資WagesIncome paid for the services of labor. 利息 InterestIncome paid for the use of capital. 利潤 Profit (or loss) Income earned by an entrepreneur for running a business.
EYE on the iPHONE Who Makes the iPhone? • Apple wants to get the iPhone manufactured at the lowest possible cost. • Apple achieves this goal by assigning the task to more than 30 companies on 3 continents who in turn employ thousands of workers. • Apple and the 30-plus firms make decisions and pay their workers, investors, and raw material suppliers to play their parts in influencing what, how, and for whom goods and services are produced. • Check page 44, the table of iPhone’s production countries
2.1 WHAT, HOW, AND FOR WHOM? Figure 2.2(a) shows the functional distribution of income in 2008: 所得的功能性分配 Wages 65% 勞動力報酬佔大部分 Rent, interest, and profit 35% 資本報酬的佔比較低
2.1 WHAT, HOW, AND FOR WHOM? Figure 2.2(b) shows the personal distribution of income in 2008: The poorest 20% earned only 3% of total income. The richest 20% earned 51% of total income.
所得分配定義 Oshima index 和 Gini coefficient • Oshima index • 大島指數 Upper 20% income Lower 20% income Gini Coefficient
2.2 THE GLOBAL ECONOMY • The People • U.S. population: 306,424,038 (May 14, 2009) • World population: 6,779,717,958 • The U.S. clock ticks along showing a population increase of one person every 12 seconds. • The world clock spins faster, adding 30 people in the same 12 seconds.
2.2 THE GLOBAL ECONOMY • The Countries Advanced Economies The richest 29 countries (or areas). 包括台灣 Almost 1 billion people (15 percent of the world’s population) live in advanced economies.
2.2 THE GLOBAL ECONOMY Emerging Market and Developing Economies Emerging market economies are the 28 countries of Central and Eastern European and Asia. Almost 500 million people live in these countries. Developing economies are the 118 countries in Africa, Asia, the Middle East, Europe, and Central and South America that have not yet achieved high average incomes for their people. More than 5 billion people live in these countries.
2.2 THE GLOBAL ECONOMY • What in the Global Economy In 2009, global economy produced about $70 trillion of goods and services. Figure 2.2 shows the shares of global production. 中國是第二大經濟體
2.2 THE GLOBAL ECONOMY • Energy The location of oil, natural gas, and coal determines the sources of the world’s energy. Figure 2.3(a) shows the distribution of oil.
2.2 THE GLOBAL ECONOMY • Energy The location of oil, natural gas, and coal determines the sources of the world’s energy. Figure 2.3(b) shows the distribution of natural gas.
2.2 THE GLOBAL ECONOMY • Energy The location of oil, natural gas, and coal determines the sources of the world’s energy. Figure 2.3(c) shows the distribution of coal.
2.2 THE GLOBAL ECONOMY U.S. interest in the Middle East probably arises because the Middle East has 56 percent of the world’s oil and 41 percent of the world’s natural gas.
2.2 THE GLOBAL ECONOMY Food Agriculture in the United States is about 1.4 percent of total U.S. production. Agriculture in developing countries averages 14 percent of their total production. Advanced economies accounts for 1/3 of world agricultural production. Why? Farms are large and highly productive and U.S. and E.U. farmers receives subsidies, which encourages more production.
2.2 THE GLOBAL ECONOMY Other Goods and Services The advanced economies produce similar goods and services. As percentages of total production, agriculture and manufacturing are small and shrinking whereas services are large and expanding. In the developing countries, agriculture is big but shrinking whereas manufacture is large and growing and services are important but small. In emerging economies, production falls between the developing economies and the advanced economies.
2.2 THE GLOBAL ECONOMY • How in the Global Economy? • Human Capital Differences 人力資本差異 The quality of labor depends on human capital. The differences in human capital between the advanced economies and the developing economies is enormous and it arises from: • Education, on-the-job training, and experience • Physical ability and state of health.
2.2 THE GLOBAL ECONOMY • Physical Capital Differences 實質資本差異 The physical capital available for producing goods and services differentiates an advanced economy from a developing economy: • Transportation system—advanced economies more developed • Technologies used on farms and in factories— advanced economies use more capital-intensive technologies.
2.2 THE GLOBAL ECONOMY 2.3 MACROECONOMIC PERFORMANCE • For Whom in the Global Economy? • Who gets the world’s goods and services depends on the incomes that people earn. • Figure 2.4 (on the next slide) shows the distribution of incomes around the world.
2.2 THE GLOBAL ECONOMY In 2009, U.S. average income was $128 a day. In advanced economies, it was about $100 a day. In Africa, it was only $7 a day.
2.3 THE CIRCULAR FLOWS • Circular flow model is a model of the economy that shows: 循環流動模型 • The circular flow of expenditures and incomes that result from decision makers’ choices and • The way those choices interact in markets to determine what, how, and for whom goods and services are produced. • 循環流動模型反映廠商與個人的最佳選擇
2.3 THE CIRCULAR FLOWS • Real Flows and Money Flows • In factor markets: • Households supply factors of production • Firms hire factors of production. • In goods markets: • Firms supply goods and services produced. • Households buy goods and services.
2.3 THE CIRCULAR FLOWS • Real Flows and Money Flows • These are the real flows in the economy. • Money flows run in the opposite direction to the real flows.
2.3 THE CIRCULAR FLOWS • Real Flows and Money Flows • Firms pay households incomes for the services of factors of production. • Households pay firms for the goods and services they buy. • These are the money flows. • Blue flows are incomes. • Red flows are expenditures.
2.3 THE CIRCULAR FLOWS • Governments in the Circular Flow Households and firms pay taxes and receive transfers. Governments buy goods and services from firms.
2.3 THE CIRCULAR FLOWS • The red flow shows the expenditure by Americans on imports of goods and services. • The blue flow show the expenditure by the rest of the world on U.S. exports (other countries’ imports).
2.3 THE CIRCULAR FLOWS • The green flow shows U.S. lending to the rest of the world. • The orange flow shows U.S. borrowing from the rest of the world.
2.3 THE CIRCULAR FLOWS • These international trade and international finance flows tie nations together. • Global booms and slumps are transmitted through these flows.