Download
1 / 1
10 likes | 80 Vues
A. 1000. 8000. 800. hs-cTnT (corrected) [ng/L]. 6000. 600. 4000. 400. 0. 2000. 4000. 6000. 8000. hs-cTnT (original) [ng/L]. B. 200. 2000. 0. 0. hs-cTnT (corrected) [ng/L]. 0. 200. 400. 600. 800. 1000. hs-cTnT (original) [ng/L]. C. 100. 80.

E N D
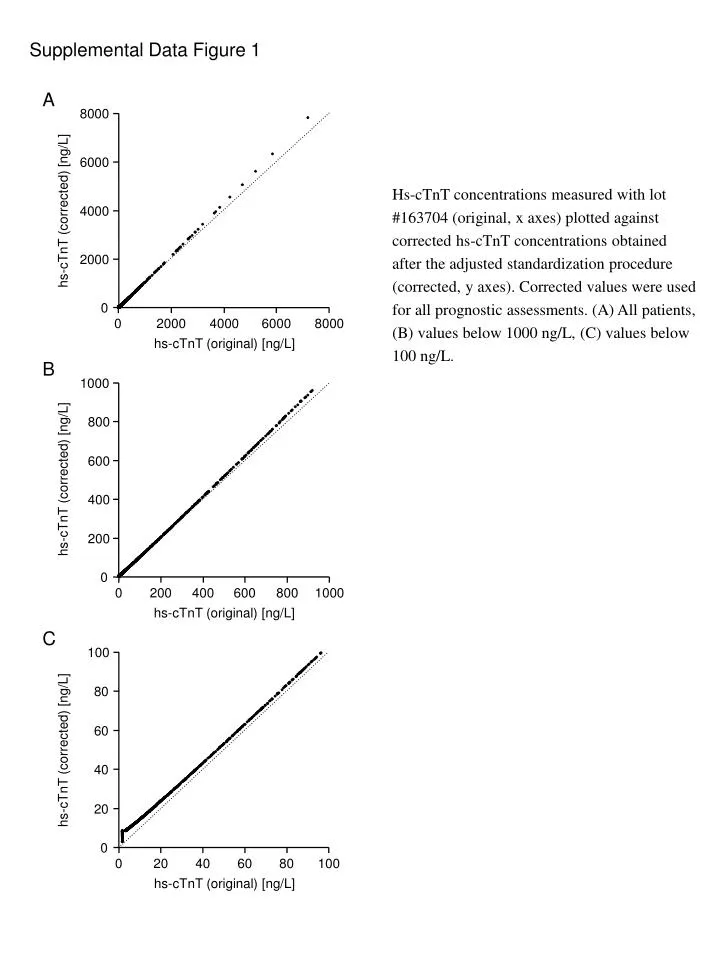
A 1000 8000 800 hs-cTnT (corrected) [ng/L] 6000 600 4000 400 0 2000 4000 6000 8000 hs-cTnT (original) [ng/L] B 200 2000 0 0 hs-cTnT (corrected) [ng/L] 0 200 400 600 800 1000 hs-cTnT (original) [ng/L] C 100 80 hs-cTnT (corrected) [ng/L] 60 40 20 0 20 40 60 80 100 0 hs-cTnT (original) [ng/L] Supplemental Data Figure 1 Hs-cTnT concentrations measured with lot #163704 (original, x axes) plotted against corrected hs-cTnT concentrations obtained after the adjusted standardization procedure (corrected, y axes). Corrected values were used for all prognostic assessments. (A) All patients, (B) values below 1000 ng/L, (C) values below 100 ng/L.