Download

1 / 33
370 likes | 643 Vues
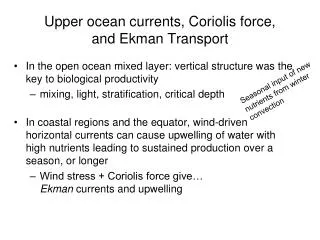
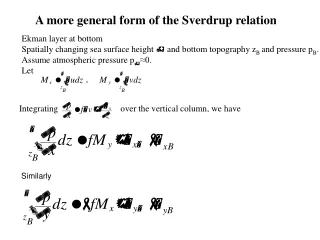
Exploring the World Ocean. Ekman Transport. Winds, friction, and the Coriolis effect act in concert to generate the patterns of flow of the upper ocean. The movement of water in response to these forces is called Ekman transport .

E N D
Exploring the World Ocean Ekman Transport • Winds, friction, and the Coriolis effect act in concert to generate the patterns of flow of the upper ocean. The movement of water in response to these forces is called Ekman transport. • The first observations of Ekman-type processes were made in the Arctic Ocean by Fridtjof Nansen, the famous Norwegian explorer-zoologist-oceanographer, and the only oceanographer to win a Nobel Prize (for his humanitarian efforts). Nansen observed that sea ice floating on the surface of the ocean drifted in a direction 20 to 30 degrees to the right of the wind. Upon his return, Nansen explained his puzzling observations to Ekman, who then formulated the mathematics to explain them. Chamberlin and Dickey, 2008
Exploring the World Ocean The Ekman Spiral • Ekman’s reasoning went something like this: 1) as the wind blows across the surface of the ocean, it sets the water in motion, but because of the Coriolis effect, the water moves to the right of the wind; 2) as the top layer begins to move, it drags the layer beneath it, due to friction; 3) as each layer moves and drags the layer beneath it, the direction of the flow is directed more towards the right, and, because of friction, each layer moves a bit more slowly. The result of these forces is a “spiral”, like a stack of cards, each of which moves in a different direction at a slower speed from top to bottom. This pattern of flow is called an Ekman spiral. • It wasn’t until 1995 with the deployment of high-resolution acoustic doppler current profilers that oceanographers actually observed an Ekman spiral (see Spotlight 9.1). Chamberlin and Dickey, 2008
Exploring the World Ocean An Ekman spiral. Note that this is not an eddy or a whirlpool. The arrows indicate speed (longer=faster) and direction. Each layer moves like a stack of 3 x 5 cards moving in different directions and at a different speed, with the fastest at the top and the slowest at the bottom. Mean Ekman transport Figure 9-4 Chamberlin and Dickey, 2008
Exploring the World Ocean A view of the forces that cause geostrophic flow. Winds indirectly supply energy that results in Ekman transport that sets up a horizontal pressure gradient. As surface flows respond to the horizontal pressure gradient, they are deflected by the Coriolis effect. A steady state is reached between the pressure gradient and the Coriolis effect resulting in geostrophic currents and the gyre circulation observed in the world ocean. Figure 9-6 Chamberlin and Dickey, 2008
Exploring the World Ocean Geostrophic “Earth-Turning” Flow • The “piling up” of water Ekman transport generates a horizontal pressure gradient (see Chapter 8). As the water moves down the pressure gradient (from high to low pressure), it is acted upon by the Coriolis effect and, in the Northern Hemisphere, deflects to the right. Ultimately, a steady-state balance is reached between the Coriolis effect and the horizontal pressure gradient and the water flows perpendicular to the the direction of the two opposing forces. • In the Northern Hemisphere, currents (gyres) move in a clockwise (anticyclonic) direction, while in the Southern Hemisphere, currents (gyres)move in a counterclockwise (cyclonic direction). This steady-state flow, caused by a horizontal pressure gradient and the Coriolis effect, is known as geostrophic flow (geostrophic means Earth turning, and so, refers to a flow under the influence of the turning Earth, i.e., the Coriolis effect. The currents generated by geostrophic flow are called geostrophic currents. Most major ocean currents are geostrophic. Chamberlin and Dickey, 2008
Exploring the World Ocean The net transport of water is 90 degrees to the right of the wind in the Northern Hemisphere and 90 degrees to the left of the wind in the Southern Hemisphere. Net flow of upper ocean from surface to Ekman layer depth. Figure 9-5 Chamberlin and Dickey, 2008
Exploring the World Ocean Trade winds blowing north and south of the equator causes surface waters to diverge. Colder water flows upwards to take its place. Equatorial upwelling cools the atmosphere and contributes to cloudiness along the equator. Figure 9-9a Chamberlin and Dickey, 2008
Exploring the World Ocean Coastal upwelling occurs as northerly winds move surface waters offshore in the Northern Hemisphere. Note that this image has been corrected from the erroneous one in the textbook. Figure 9-10a (upper) Chamberlin and Dickey, 2008
Exploring the World Ocean Coastal downwelling occurs as southerly winds move surface waters onshore in the Northern Hemisphere. Note that this image has been corrected from the erroneous one in the textbook. Figure 9-10a (lower) Chamberlin and Dickey, 2008
Exploring the World Ocean Storm systems (low pressure centers) with cyclonic circulation (Northern Hemisphere) also cause upwelling. In recent years, oceanographers have recognized that low pressure systems and hurricanes act like a pump to bring nutrients to the surface and stimulate phytoplankton productivity. Figure 9-11 (left) Chamberlin and Dickey, 2008
Exploring the World Ocean High pressure systems with anticyclonic circulation (Northern Hemisphere) cause downwelling. Downwelling can limit phytoplankton productivity by shutting off the deepwater supply of nutrients. It has been suggested that regions where high pressure systems persist, such as Bermuda and Hawaii, are oligotrophic because of depression of the thermocline and limitation of nutrient supply. Figure 9-11 (right) Chamberlin and Dickey, 2008
Exploring the World Ocean Western Intensification • Oceanographers long observed that western boundary currents were faster and narrower than eastern boundary currents, a phenomenon known as western intensification. However, they were unable to explain why this occurs. In 1948, Henry Stommel, a man who has been called “the most original and important physical oceanographer of all time,” proposed that variations in the Coriolis effect with latitude may be the reason. Because the Coriolis effect becomes stronger at higher latitudes, he reasoned that it might account for the narrowing of streamlines on the western boundaries of gyres. When he put it into a mathematical model, that’s exactly what happened. Chamberlin and Dickey, 2008
Exploring the World Ocean Stommel’s model of gyre circulation without the Coriolis effect (upper) and with the Coriolis effect (lower) illustrates the importance of the Coriolis term for explaining western intensification. Figure 9-15 Chamberlin and Dickey, 2008
Exploring the World Ocean Figure 9-3 Chamberlin and Dickey, 2008
Exploring the World Ocean Figure 9-12 Chamberlin and Dickey, 2008
Exploring the World Ocean Chamberlin and Dickey, 2008
Exploring the World Ocean Chamberlin and Dickey, 2008
Exploring the World Ocean Chamberlin and Dickey, 2008
Exploring the World Ocean Circumpolar Chamberlin and Dickey, 2008
Exploring the World Ocean Chamberlin and Dickey, 2008
Exploring the World Ocean Chamberlin and Dickey, 2008
Exploring the World Ocean Figure 9-18 Chamberlin and Dickey, 2008
Exploring the World Ocean Figure 9-18 Chamberlin and Dickey, 2008
Exploring the World Ocean Water Masses • The waters that make up the deep circulation and their patterns of flow are identified through their temperature and salinity characteristics. A parcel of water with a distinct and narrow range of temperature and salinity is called a water mass. Specific T and S characteristics define water types. The distinction is important oceanographically because water types may mix to produce a given water mass. • Water masses (and water types) are typically named according to the location where they originate. For example, a water mass that forms in the North Atlantic includes North Atlantic in its name. Water masses are also named according to their density and the layer that they occupy in the world ocean. Chamberlin and Dickey, 2008
Exploring the World Ocean Temperature-Salinity Diagrams • Identification of a specific water mass is most easily accomplished by noting its “location” on graph of temperature versus salinity, otherwise known as a T-S diagram. Introduced in 1916 by Norwegian oceanographer Bjorn Helland-Hansen, the T-S diagram remains one of the most useful tools in physical oceanography today. • A T-S diagram is composed of a set of CTD measurements of T and S, say, several to hundreds of vertical profiles, that are plotted on an X-Y axis with salinity on the X-axis and temperature on the Y-axis. Because different combinations of T and S correspond to the same density, lines of equal density, or isopycnals, can also be plotted. Isopycnals and inflection points can be used to identify specific water masses. Chamberlin and Dickey, 2008
Exploring the World Ocean Vertical profiles of temperature and salinity in the Gulf Stream (left) and the corresponding T-S diagram. Note the isopycnals in this diagram, shown as sigma-t. Each line represents the range of T and S that produce the same density. Can you identify three combinations of T and S that produce water with a sigma-t of 25.0? From The Oceans, Their Physics, Chemistry, and General Biology, 1942. Chamberlin and Dickey, 2008 http://content.cdlib.org/xtf/view?docId=kt167nb66r&brand=eschol
Exploring the World Ocean The Deep Circulation • If the surface circulation is the speedy hare, the deep circulation is the slow and purposeful tortoise. The deep circulation likely controls Earth’s climate over time scales of thousands of years. Unfortunately, it is the hardest to study and one of the least understood components of the world ocean system. • The deep circulation extends from about 1 km (0.5 miles) deep to the seafloor, which means that most of the world ocean is part of the deep circulation at any one time. • Deep water masses may by 600 to 1000 years old or more. Their “age” represents the time that has passed since their formation and return to the surface. Chamberlin and Dickey, 2008
Exploring the World Ocean The Great Ocean Conveyor Figure 9-24 Chamberlin and Dickey, 2008
Exploring the World Ocean A more realistic model of world ocean circulation, emphasizing the role of the Southern Ocean. Figure 9-25 Chamberlin and Dickey, 2008
Exploring the World Ocean Some of the many processes that may influence the deep circulation. Identifying the dominant forces is a major goal of physical oceanographers. Figure 9-23 Chamberlin and Dickey, 2008
Exploring the World Ocean The Coupled Surface and Deep Circulation • Physical oceanographers now emphasize the connection between the surface and deep circulation. Changes in one affect the other. For example, a slow-down in the Gulf Stream impacts the delivery of salts for North Atlantic Deep Water (NADW) formation. At the same time, a slowdown in NADW formation may alter Gulf Stream flows as some NADW recirculates into the Gulf Stream in the North Atlantic. • Bottom line: It’s a big, complicated ocean that we are just beginning to understand. That said, there are ample opportunities for exploration and discovery. Perhaps one of you have a mind to figure it out...! Chamberlin and Dickey, 2008