Download
1 / 45
450 likes | 564 Vues
Trends in Enrolments. Three major events Impact of middle schooling Impact of universal prep Impact of the GFC (Global Financial Crisis). Sector-wise things look pretty good. Independent school enrolments are increasing. Independent school marketshare is increasing.

E N D
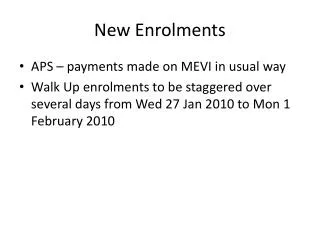
Trends in Enrolments Three major events Impact of middle schooling Impact of universal prep Impact of the GFC (Global Financial Crisis)
Sector-wise things look pretty good Independent school enrolments are increasing
Forecast Growth in Children Aged 4-16, 2006-2011 and 2011-2016
BUT • While the future looks good at the State level..... • Just like some States have growth and some have decline forecast, areas of the State are also experiencing differences....... • Its knowing what's happening where and when that's important.
And • There are a couple of other things you need to be aware of: • What has happened to Independent school marketshare following the introduction of ‘universal’ prep • What increased middle school intakes, and increased Independent school participation in primary, may mean for secondary intakes • What has happened to enrolment levels as a consequence of the “GFC”…it too has had an impact.
The following information is to help answer these questions…. • To make it easier (and more specific to your school) • Independent schools have been grouped into regions, based on ABS’s Statistical Subdivisions (SSDs). • In some cases a number of SSDs have been grouped together for reporting purposes – in order to ensure confidentiality of individual school enrolments. • You have a list showing which region your school belongs in. • The following gives an idea of the areas:
Part 1: Enrolment Patterns • Enrolments are for 2003-2008 (Commonwealth Census) • Data excludes distance education students and special schools • There is a ‘data-break’ in enrolment numbers with the half-cohort in 2007. This means: • P-12 enrolments can’t be compared pre 2007 to post 2007 • P-7 enrolments can’t be compared pre 2007 to post 2007 • Year 8-12 can be compared as they will not be impacted until the half cohort enters Year 8 • Key to future trends is looking at the major intake years – Prep and Year 8….if these are increasing it’s good! • However, prep enrolments are ‘unreliable’ with a half cohort in 2007, followed by a full cohort….so Year 1 enrolments from 2003-2007 are the best indicator currently available for trends in numbers of students entering the education system. • Year 8 hasn’t been impacted – so we can look at trends from 2003-2008
Where future growth is likely…Year 1 enrolmentsprovidean indication…compare annual growth rates of Year 1 to Year 8….where are rates slowing….
Part 2 - Marketshare • There are generally two ways a school (or sector) increases enrolments… • Through catering for enrolment growth in the area • Through capturing marketshare • Reporting of marketshare is not impacted by the half-cohort in prep…..except in as much as there has been a major shift in marketshare • Overall the Independent sector tends to have gained marketshare….but not everywhere… • In your school’s area has the Independent sector gained (or lost) marketshare to Catholic and/or State schools?
A different way of looking at Prep…comparing marketshare Prep in 2008 to Year 1 marketshare in 2007
Who has gained marketshare…and where Green = marketshare gains Red = marketshare losses Blank = no change (usually due to the sector having no schools in the area)
Difference between Prep 2008 marketshare compared to Year 1 marketshare 2007 Overall a slight increase in State school marketshare – 1.3%. Highest increase in State school marketshare suggested in Gold Coast North.
Part 2: Impact of middle school intakes • Traditionally major intakes have occurred at Prep/Preschool, Year 1 (prior to 2007) and Year 8 • This pattern is still prevalent in the State sector and the Catholic sector (with the exception of Year 1 ceasing to be a major intake year with the introduction of prep). • In some areas, particularly growth areas, the State has moved on occasion to a P-12 model as have a number of Catholic schools (particularly order schools moving from a secondary model to a middle and secondary model e.g. Year 5-12). • The majority of Independent schools offer P-12, with a large number having moved to a junior, middle and senior school structure. • Major intakes being in Prep, the start of the ‘middle school’ (Year 5, 6 or 7) and Year 8.
What is the potential impact? • Has the introduction of an increased intake into the middle school years resulted in more students entering Independent schools OR • Has it meant that students who would have been expected to enter Year 8 have just entered earlier….resulting in fewer students entering in Year 8 (and difficulties in filling Year 8 intakes)
Apparent Progression of Year 7 students going to Year 8 in Independent schools • Compares the number of Year 7 students in one year to the number of Year 8 students in the next year at Independent schools. • Gives an indication of the proportion of ‘new’ students compared to existing students progress • The higher the progression rate the greater proportion of students at the school are ‘new’ students.
Proportion of ‘New’ Year 8 Students at Independent schools of All Year 8 Students in an area….marketshare gains (or losses)
Tied up with this is the growth rate in primary in Independent schools versus the growth rate in secondary schooling. • If this continues…….. Source: ABS Census, Qld
How will schools with 4 streams in secondary and 2 streams in the middle school fill Year 8 enrolments?
Part 3: The Global Financial Crisis Has it had an impact? Enrolments have continued to grow Note: February data for 2009 was only available at the school level for Independent schools. As a result we don’t know what happened in other sectors. Data excludes FFPOS and Distance education students.
But • Rate of growth slowed in terms of • P-12 enrolments • P-7 enrolments • Year 8 enrolments
Another possible impact • Reduction in the level of in-migration • Students entering Independent schools from other sectors and/or interstate and overseas reduced in the 2008-09 period compared to the 2007-08 period (12.7% reduction) • E.g. In 2008 there were 5,977.2 more students in Years 2 to 12 than there were students in Years 1-11 in 2007 (who are the Year 2-12 cohort in 2008). In 2009 there were 5,220.7 more students in Years 2 to 12 than there were students in Years 1-11 in 2008 (who are the Year 2-12 cohort in 2009). • Progression rates have also reduced
Migration Progression Rates
Note: Progression rates 10-11 and 11-12 are excluded as in bad economic times you expect an increase in retention (as jobs aren’t available)
So... • What does all of this mean? What should schools do? • You probably need to ask for a statistical analysis every five or so years • Look at your statistical area – • If there is a decline in numbers, you need to market; and ‘catch’ enrolments from other sectors • If there is growth, is the growth enough? Is there going to be a problem overtime with middle schooling enrolments? What does this mean in terms of changes you might need to consider?