Download
1 / 30
320 likes | 522 Vues
Fuzzy arithmetic in risk analysis. Scott Ferson Applied Biomathematics scott@ramas.com. Fuzzy numbers. Fuzzy set that’s unimodal and reaches 1 Nested stack of intervals. Fuzzy addition. 1.

E N D
Fuzzy arithmetic in risk analysis Scott Ferson Applied Biomathematics scott@ramas.com
Fuzzy numbers • Fuzzy set that’s unimodal and reaches 1 • Nested stack of intervals
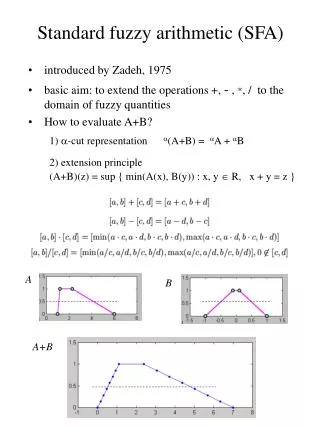
Fuzzy addition 1 • Subtraction, multiplication, division, minimum, maximum, exponentiation, logarithms, etc. are also defined. • If distributions are multimodal, possibility theory (rather than just simple fuzzy arithmetic) is required. A B A+B 0.5 0 0 2 4 6 8
Kinds of numbers • Scalars are well known or mathematically defined integers and real numbers • Intervals are numbers whose values are not know with certainty but about which bounds can be established • Fuzzy numbers are uncertain numbers for which, in addition to knowing a range of possible values, one can say that some values are more plausible, or ‘more possible’ than others
What is possibility? • No single definition • Depends on your applications • Many definitions could be used • Subjective assessments • Social consensus • Measurement error • Upper betting rates (Giles) • Extra-observational ranges (Gaines)
How to get fuzzy inputs • Subjective assignments • Make them up from highest, lowest and best-guess estimates • Objective consensus • Stack up consistent interval estimates or bridge inconsistent ones • Measurement error • Infer from measurement protocols • Other special ways
Subjective assignments • Triangular fuzzy numbers, e.g., [1,2,3] • Trapezoidal fuzzy numbers, e.g., [1,2,3,4] Possibility
1 0.5 0 0 2000 4000 Objective consensus [1000, 3000] [2000, 2400] [500, 2500] [800, 4000] [1900, 2300] Possibility
46.8 0.3 [46.5, 46.8, 47.1] [12.32] [12.315, 12.32, 12.325] 1 Possibility 0 46.5 46.7 46.9 47.1 1 Possibility 0 12.31 12.32 12.33 Measurement error
When the data are inconsistent • Find and emphasize regions of consonance • Let possibility flow to intersections • Doesn’t work for totally disjoint data sets • May have counterintuitive features • Use (agglomerative hierarchical) clustering • Single linkage, complete linkage, UPGMA, etc. • Can define ‘similarity’ between intervals in various ways • Even works for totally disjoint data sets
Examples (Donald 2003)
Betting definition • By asserting a A, you agree to pay $1 if A is false. • If the probability of A is P, then a Bayesian rational agent should agree to assert A for a fee of $(1-P), and should equally well assert not-A for a fee of $P. Although refusing to bet is not irrational, Bayesians don’t allow this. • Possibility of A can be measured as the smallest number [0,1], such that, for $, a rational agent will agree to pay $1 if A is found to be false. • Possibility is thereby an upper bound on probability.
1 Possibility 0 theoretical minimum theoretical maximum Extra-observational ranges • Theoretical ranges are often very wide • The range between the minimum and maximum observed values (where the data is) should be modeled by probability theory • Fuzzy/possibility is about the range within the theoretical range but beyond observations minimum observed maximum observed
1 X Possibility 0 0 1 2 3 4 5 6 7 1 X de h + g Possibility X fe 0 -20 -10 0 10 20 30 40 Xde/(h+g)fe Robustness Triangular fuzzy numbers are robust characterizations d = [0.3, 1.7, 3] e = [ 0.4, 1, 1.5] f = [ 0.8, 6, 10] g = [ 0.2, 2, 5] h = [ 0.6, 3, 6]
Distributional results • Tails describe possible extremes • More comprehensive than intervals • Full distribution of various magnitudes
Probability theory Axioms 0 P() 1 P() = 1 P(AB) = P(A) + P(B) whenever AB= Convolution C(z) = A(x) B(y) Possibility theory Axioms () = 0 () = 1 (A) (B) whenever AB Convolution C(z) = VA(x) B(y) Comparison v z=x+y z=x+y
A+B = 3 = 0.2 A+B = 4 = 0.2 A+B = 5 = 0.2 A+B = 6 = 0.2 A+B = 3 = 0.3 A+B = 4 = 0.7 A+B = 5 = 0.8 A+B = 6 = 0.6 A+B = 7 = 0.4 A+B = 4 = 0.3 A+B = 5 = 0.7 A+B = 6 = 1.0 A+B = 7 = 0.6 A+B = 8 = 0.4 A+B = 5 = 0.2 A+B = 6 = 0.2 A+B = 7 = 0.2 A+B = 8 = 0.2 A+B = 9 = 0.2 Max-min convolutions A = 1 = 0.3 A = 2 = 0.7 A = 3 = 1.0 A = 4 = 0.6 A = 5 = 0.4 A + B B = 1 =0.2 A+B = 2 = 0.2 B = 2 =0.8 B = 3 = 1.0 B = 4 = 0.2
1 A 0 1 1 2 3 4 5 B 1 0 1 2 3 4 A+B 0 2 4 6 8 Result of convolution If the inputs are fuzzy numbers (unimodal, reach 1), then possibilistic convolution is the same as level-wise interval arithmetic (Kaufmann and Gupta)
1 1 X Y 0.5 0.5 0 0 0 2 4 6 8 0 2 4 6 8 10 10 1 1 X+X Y+Y Probability Possibility 0.5 0.5 0 0 0 2 4 6 8 0 2 4 6 8 10 10 0.4 1 X+…+X 0.2 0.5 Y+…+Y 0 0 0 2 4 6 8 0 2 4 6 8 10 10
Computational cost Analysis Operations Deterministic F Interval analysis 4F Fuzzy arithmetic MF Monte Carlo NF Second-order Monte Carlo N2F where M ~ [40,400], and N ~ [1000, 100000]
Worst case Interval analysis Fuzzy arithmetic Monte Carlo extreme values ranges ranges or distributions distributions and dependencies Data needs
Backcalculations • Deconvolutions in fuzzy arithmetic are completely straightforward level-wise generalizations of interval deconvolutions • Easy, fast • When impossible, yields no answer
Software • FuziCalc • (Windows 3.1) FuziWare, 800-472-6183 • Fuzzy Arithmetic C++ Library • (C code) anonymous ftp to mathct.dipmat.unict.it and get \fuzzy\fznum*.* • Cosmet (Phaser) • (DOS, soon for Windows) acooper@sandia.gov • Risk Calc • (Windows) 800-735-4350; www.ramas.com
Another example Consider a simple example model of octanol contamination of groundwater due to Lobascio (1993 Uncertainty analysis tools for environmental modeling. ENVIRONews 1:6-10). Its assumptions include one-dimensional constant uniform Darcian flow, homogeneous material properties, linear retardation, no dispersion, and the governing equation T = (n + BDfocKoc ) L / (Ki). Distance from source to receptor L = [ 80, 100, 120] m Hydraulic gradient i = [0.0003, 0.0005, 0.0008] m m-1 Hydraulic conductivity K = [ 300, 1000, 3000] m yr-1 Effective soil porosity n = [ 0.2, 0.25, 0.35] Soil bulk density BD = [ 1500, 1650, 1750] kg m-3 Fraction of organic carbon in soil foc = [0.0001, 0.0005, 0.005] Octanol-water partion coefficient Koc = [ 5, 10, 20] m3 kg-1
Reasons to use fuzzy arithmetic • Requires little data • Applicable to all kinds of uncertainty • Fully comprehensive • Fast and easy to compute • Doesn’t require information about correlations • Conservative, but not hyperconservative • In between worst case and probability • Backcalculations easy to solve
Reasons not to use it • Controversial • Are alpha levels comparable for different variables? • Not optimal when there're a lot of data • Can’t use knowledge of correlations to tighten answers • Not conservative against all possible dependencies • Repeated variables make calculations cumbersome
References • Dubois, D. and H. Prade 1988 Possibility Theory: An Approach to Computerized Processing of Uncertainty. Plenum Press, New York. • Kaufmann, A. and M.M. Gupta 1985 Introduction to Fuzzy Arithmetic: Theory and Applications. Van Nostrand Reinhold, New York. • Zadeh, L. 1978 Fuzzy sets as a basis for a theory of possibility. Fuzzy Sets and Systems 1: 3-28.
Applications • Bardossy, A., I. Bogardi and L. Duckstein 1991 Fuzzy set and probabilistic techniques for health-risk analysis. Applied Mathematics and Computation 45:241-268. • Duckstein, L., A. Bardossy, T. Barry and I. Bogardi 1990 Health risk assessment under uncertainty: a fuzzy risk methodology. Risk-based Decision Making in Water Resources. Y.Y. Haimes and E.Z. Stakhiv (eds.), American Society of Engineers, New York. • Ferson, S. 1993 Using fuzzy arithmetic in Monte Carlo simulation of fishery populations. Management Strategies for Exploited Fish Populations, T.J. Quinn II (ed.), Alaska Sea Grant College Program, AK-SG-93-02, pp. 595-608. • Millstein, J.A. 1994. Propagation of measurement errors in pesticide application computations. International Journal of Pest Management 40:149-165. 1995 Simulating extremes in pesticide misapplication from backpack sprayers. 41: 36-45.